อ่านรายละเอียดเพิ่มเติม

 18.08.2023 05:59 AM
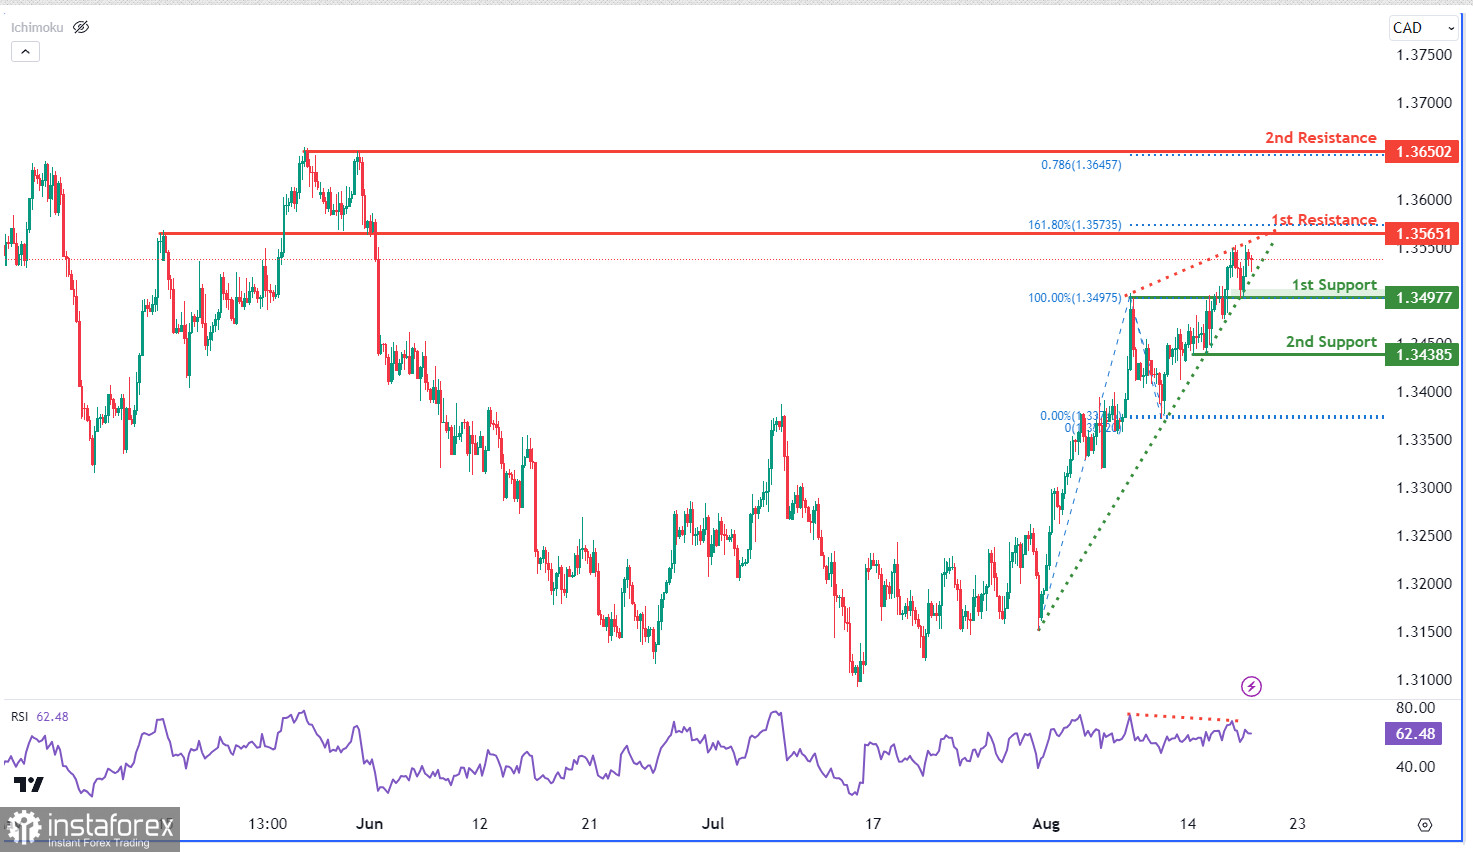
แผนภูมิ USD/CAD แสดงแนวโน้มตลาดตกต่ำซึ่งได้รับการเสริมแรงจากตัวชี้วัด RSI ที่แสดงถึงการแบ่งแยกตลาดตกต่ำร่วมกับราคา ราคาอาจลงสู่ระดับสนับสนุนครั้งแรกที่ 1.3498 และระดับสนับสนุนครั้งที่สองที่ 1.3387 ซึ่งเป็นระดับสนับสนุนที่ซ้อนทับกัน ในทางตรงกันข้าม ระดับความต้านทานครั้งแรกที่ 1.3565 จะพอดีกับการขยาย Fibonacci ที่ 161.80% และระดับความต้านทานครั้งที่สองที่ 1.3650 ตรงกับการนำเสนอ Fibonacci ที่ 78.60% ซึ่งแสดงให้เห็นว่าเป็นระดับความต้านทานที่สูงในช่วงหลายครั้ง
นอกจากนี้ แม่แบบรูปเรียวยกขึ้นเป็นตัวบ่งชี้การเปลี่ยนแนวโน้มซึ่งมักเห็นในตลาดหมี ลักษณะนี้เกิดขึ้นเมื่อราคาขึ้นด้วยจุดสูงและต่ำที่สนุกสนานสู่จุดยอด หากมีปริมาณการซื้อขายลดลงอาจบ่งชี้ถึงการดำเนินตลาดในทิศทางเดิมของตลาดหมี
You have already liked this post today
*บทวิเคราะห์ในตลาดที่มีการโพสต์ตรงนี้ เพียงเพื่อทำให้คุณทราบถึงข้อมูล ไม่ได้เป็นการเจาะจงถึงขั้นตอนให้คุณทำการซื้อขายตาม


