Vea también

 24.03.2023 06:37 PM
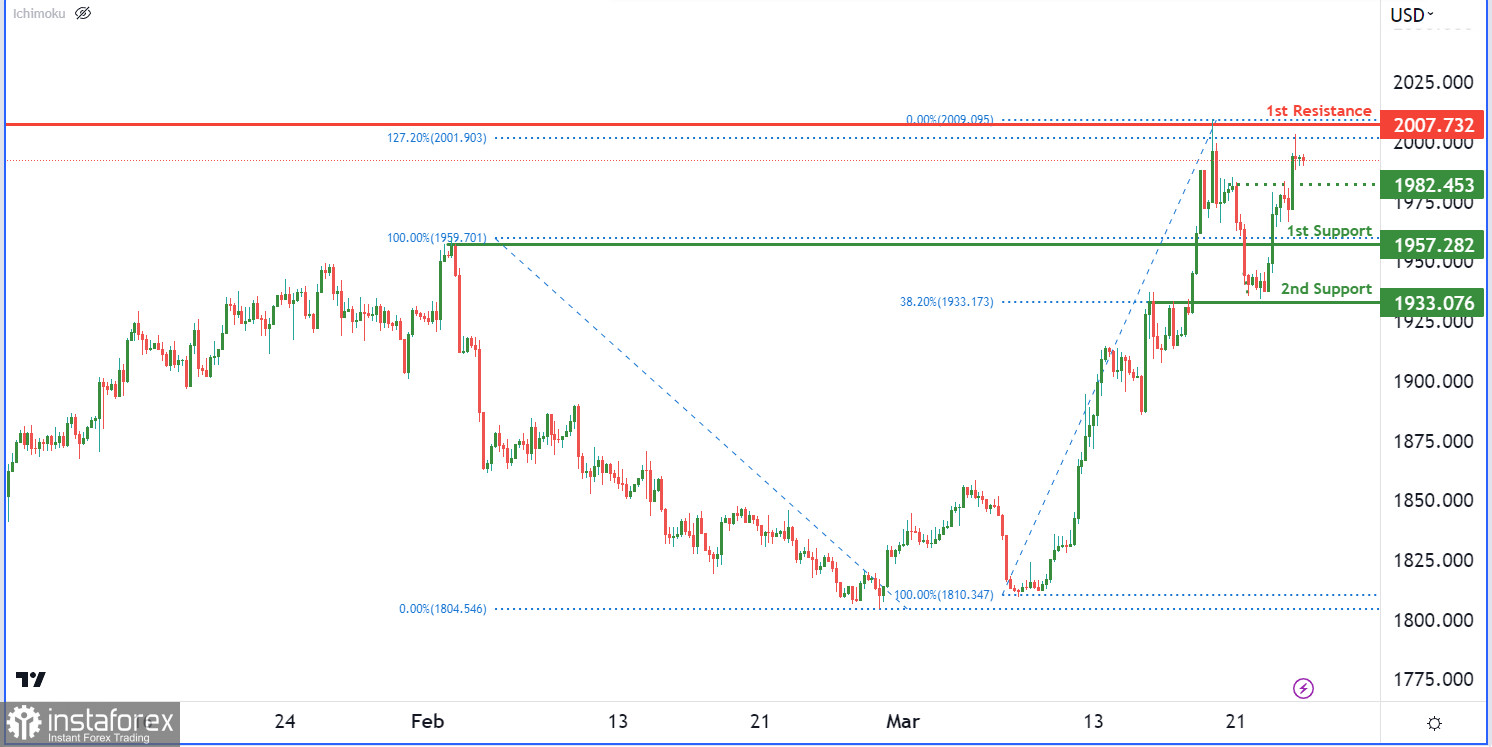
El gráfico XAU/USD actualmente tiene un impulso bajista, con potencial para una reacción bajista desde el primer nivel de resistencia en 2007 y una caída hacia el primer nivel de soporte en 1957. Este nivel de soporte ha mantenido los precios arriba antes y si se rompe, el precio podría caer hacia el segundo nivel de soporte en 1933. En el lado de la resistencia, el primer nivel de resistencia está en 2007 con una extensión de Fibonacci del 127%. Un nivel de soporte intermedio en 1982 podría actuar como un soporte de retroceso si el precio cae.
You have already liked this post today
*El análisis de mercado publicado aquí tiene la finalidad de incrementar su conocimiento, más no darle instrucciones para realizar una operación.


