Veja também


 13.11.2023 09:27 AM
Trend analysis (Fig. 1).
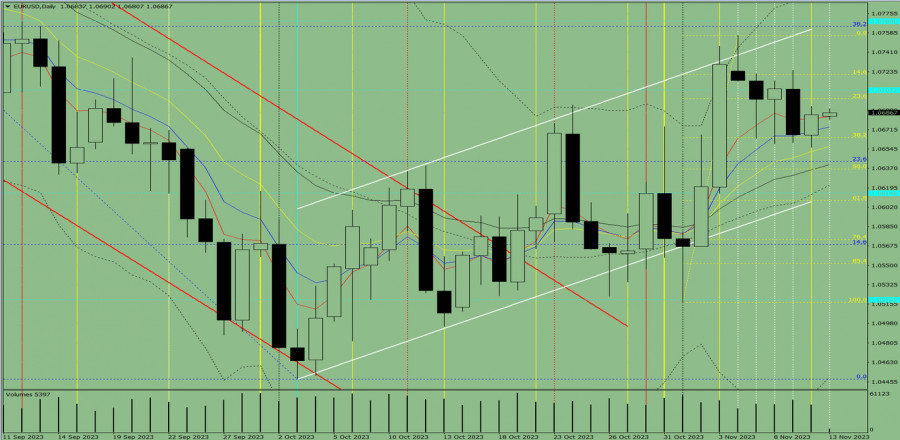
The EUR/USD currency pair may move downward from the level of 1.0685 (closing of Friday's daily candle) to 1.0664, the 38.2% pullback level (yellow dotted line). In the case of testing this level, an upward movement is possible with a target at 1.0699 23.6% (yellow dotted line). Upon reaching this level, the price may continue to move upward to 1.0707, the historical resistance level (blue dotted line).
Fig. 1 (daily chart).
Comprehensive analysis:
Today, the price may move downward from the level of 1.0685 (closing of Friday's daily candle) to 1.0664, the 38.2% pullback level (yellow dotted line). In the case of testing this level, an upward movement is possible with a target at 1.0699 23.6% (yellow dotted line). Upon reaching this level, the price may continue to move upward to 1.0707, the historical resistance level (blue dotted line).
Alternatively, the price may move downward from the level of 1.0685 (closing of Friday's daily candlestick) to 1.0636, the 50% pullback level (yellow dotted line). In the case of testing this level, an upward movement is possible with a target at 1.0699, the 23.6% pullback level (yellow dotted line).
You have already liked this post today
*A análise de mercado aqui postada destina-se a aumentar o seu conhecimento, mas não dar instruções para fazer uma negociação.
No início da sessão americana, o ouro está sendo negociado próximo de 3.220, mostrando sinais de exaustão. Uma nova correção técnica em direção à SMA 21 é provável nas próximas
No gráfico de 4 horas, o par GBP/AUD parece estar se movendo abaixo da sua média móvel exponencial de 21 períodos (EMA 21), e o Oscilador Estocástico indica uma condição
Nosso plano de negociação para as próximas horas é vender o ouro abaixo de 3.224, visando os alvos 3.203 e 3.156. Devemos estar atentos a qualquer recuperação técnica
Com a formação de uma divergência no indicador Estocástico em relação ao movimento de preço do par XPD/USD no gráfico de 4 horas — somada ao surgimento de um padrão
No gráfico de 4 horas o Petróleo Bruto, podemos observar a formação de um padrão OCO Invertido (Cabeça & Ombro Invertido), além do Padrão Altista 123 e uma divergência entre
Contas PAMM
da InstaForex

Your IP address shows that you are currently located in the USA. If you are a resident of the United States, you are prohibited from using the services of InstaFintech Group including online trading, online transfers, deposit/withdrawal of funds, etc.
If you think you are seeing this message by mistake and your location is not the US, kindly proceed to the website. Otherwise, you must leave the website in order to comply with government restrictions.
Why does your IP address show your location as the USA?
Please confirm whether you are a US resident or not by clicking the relevant button below. If you choose the wrong option, being a US resident, you will not be able to open an account with InstaTrade anyway.
We are sorry for any inconvenience caused by this message.

