Veja também

 25.12.2020 10:54 AM
EUR/USD – 1H.
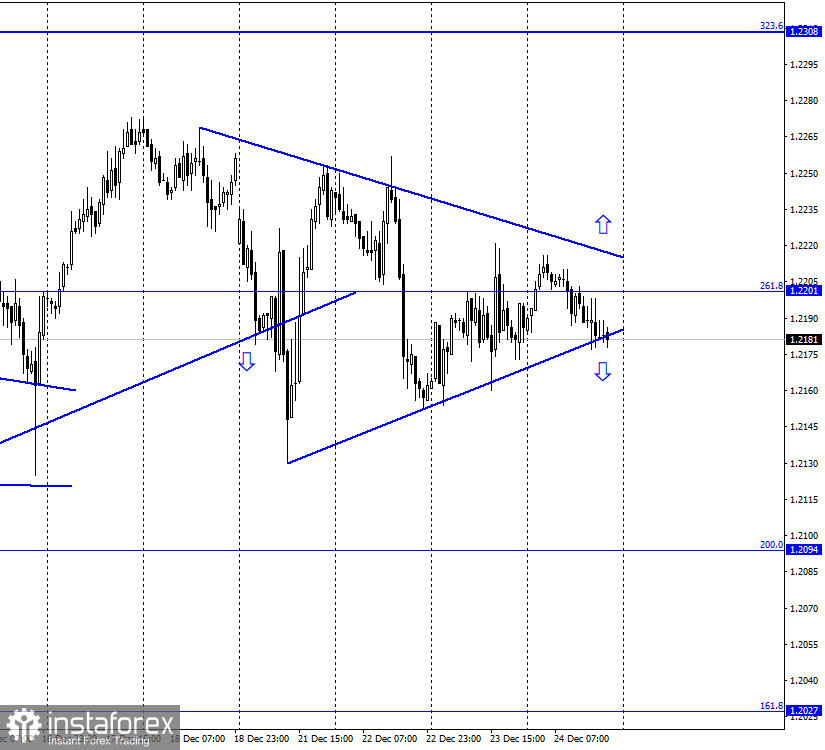
On December 24, the EUR/USD pair performed a reversal in favor of the US currency and returned to the upward trend line. The rebound of quotes from this line will allow traders to count on a reversal in favor of the EU and the resumption of growth in the direction of the downward trend line. However, traders should wait for the exit from the "narrowing triangle" now. It is unclear whether it will take place during the new year's week. After all, we are interested in the signals that will be generated in this case. But it may well end with the usual movement in the side corridor and a little activity. Thus, next week, you need to remember that there are little news and reports now, as well as the desire of traders to trade. Already this week, it was clear that traders are celebrating Christmas in their minds. There was some news, however, the number of traders working on it was getting smaller and smaller every day. In fairness, it should be noted that there were practically no really important messages. Donald Trump's actions did not surprise anyone, thus, his blocking of the aid package for American citizens and the country's economy did not worry traders. The same goes for the defense budget. And nothing else interesting happened in America. In the European Union, all the attention of absolutely everyone was turned to the trade deal with the UK, which was reached only yesterday. However, this deal is much more important for Britain than for the EU, so the euro currency reacted to any news about Brexit 10 times weaker than the pound.
EUR/USD – 4H.
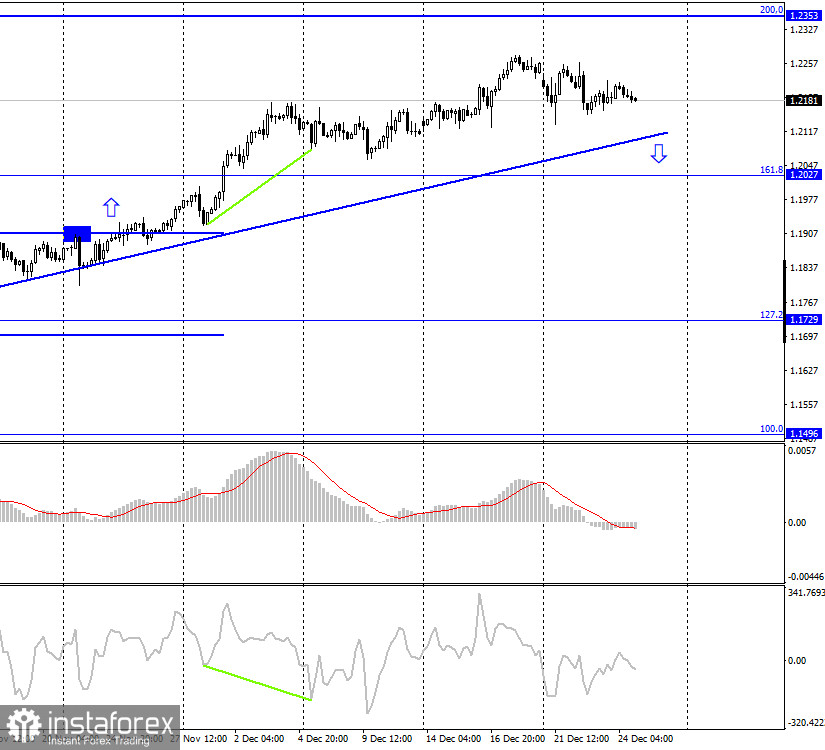
On the 4-hour chart, the pair's quotes performed a reversal in favor of the US dollar and began a very calm decline in the direction of the ascending trend line, which continues to characterize the current mood of traders as "bullish". The rebound of quotes from this trend line will work in favor of the euro and the resumption of growth in the direction of the corrective level of 200.0% (1.2353). Anchoring below the trend line will increase the likelihood of further falls.
EUR/USD – Daily.
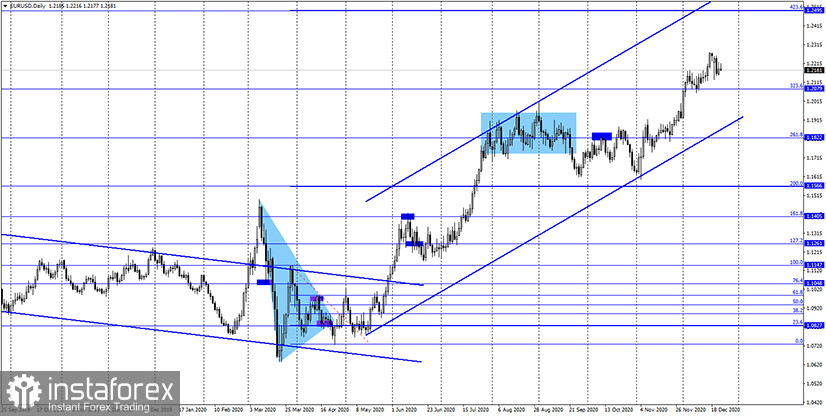
On the daily chart, the quotes of the EUR/USD pair continue the process of growth in the direction of the corrective level of 423.6% (1.2495). Until the moment when the pair makes a consolidation under the level of 323.6%, there are still high chances of growth.
EUR/USD – Weekly.
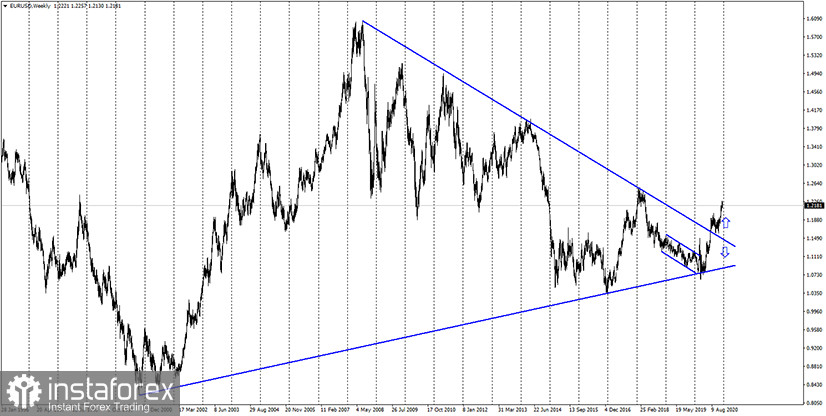
On the weekly chart, the EUR/USD pair performed a consolidation above the "narrowing triangle", which preserves the prospects for further growth of the pair in the long term.
Overview of fundamentals:
On December 24, there was not a single important news or report in the United States and the European Union. There was no information background.
News calendar for the United States and the European Union:
On December 25, there will again be no reports and news in America and the European Union. The foreign exchange market is closed today and trading will resume on Monday.
COT (Commitments of Traders) report:
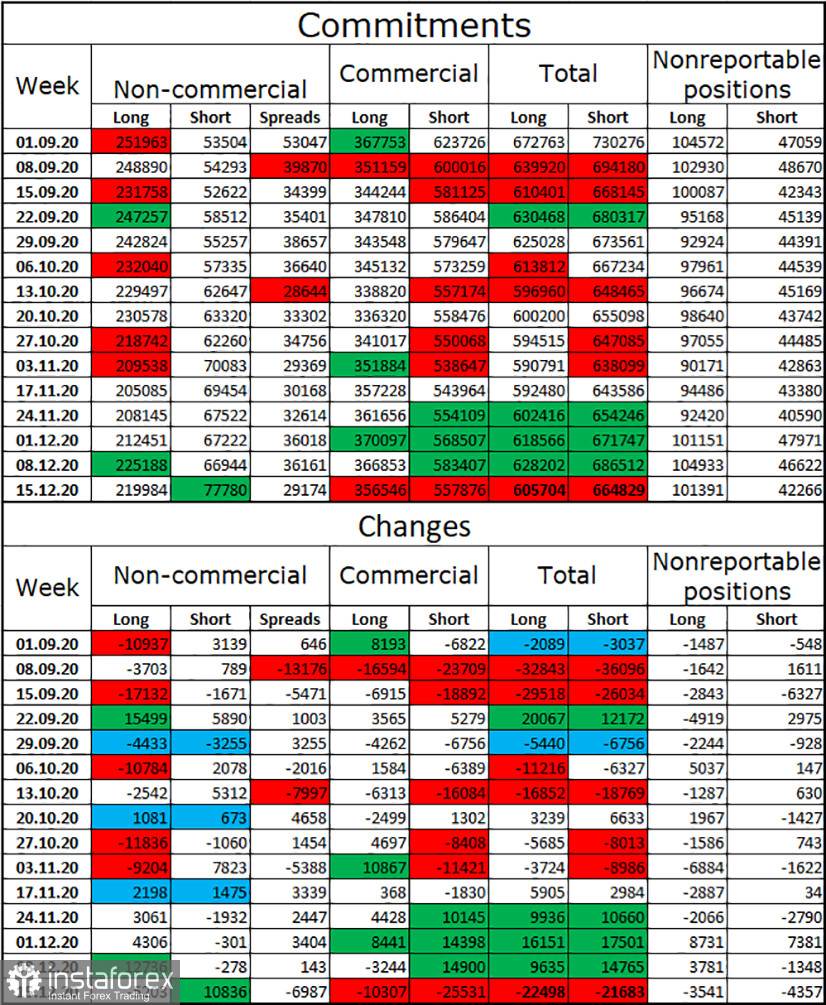
For four weeks in a row, the mood of the "Non-commercial" category of traders became more "bullish". This was indicated by COT reports and it coincided with what was happening on the euro/dollar pair. However, in the reporting week, speculators opened as many as 11 thousand new short-contracts, and also closed 5,200 long-contracts. Thus, they significantly weakened their bullish mood. And despite this, the euro continues to show growth. However, a sharp change in the mood of the "Non-commercial" category of traders does not mean that the euro currency should immediately fall. The latest COT report shows that speculators are once again preparing for a fall in the euro currency or at least for the end of its growth.
EUR/USD forecast and recommendations for traders:
On Monday, I recommend selling the euro currency in case the price is fixed under the lower trend line on the hourly chart with the target level of 200.0% (1.2094). New purchases of the pair can be opened with a target of 1.2308 when the quotes are fixed above the descending trend line on the hourly chart.
Terms:
"Non-commercial" - major market players: banks, hedge funds, investment funds, private, large investors.
"Commercial" - commercial enterprises, firms, banks, corporations, companies that buy currency, not for speculative profit, but to ensure current activities or export-import operations.
"Non-reportable positions" - small traders who do not have a significant impact on the price.


