یہ بھی دیکھیں


 18.10.2022 03:38 PM
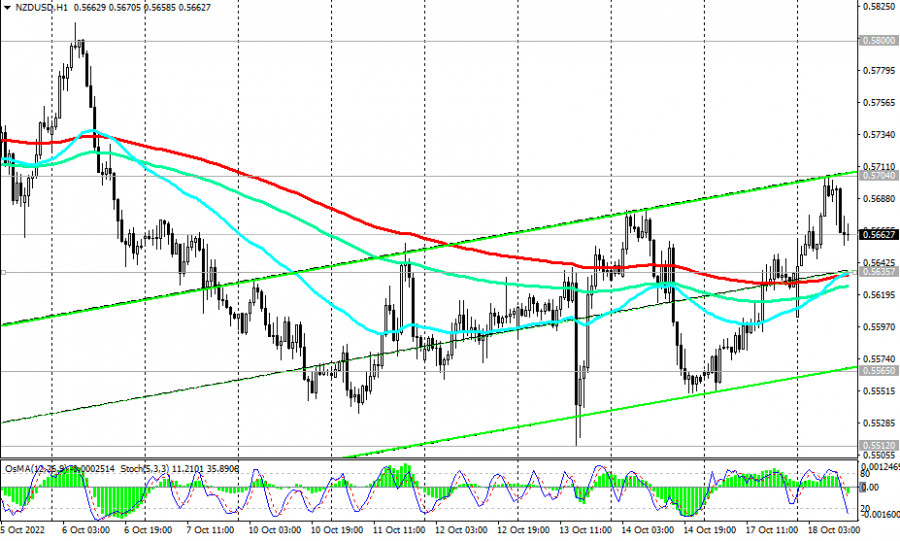
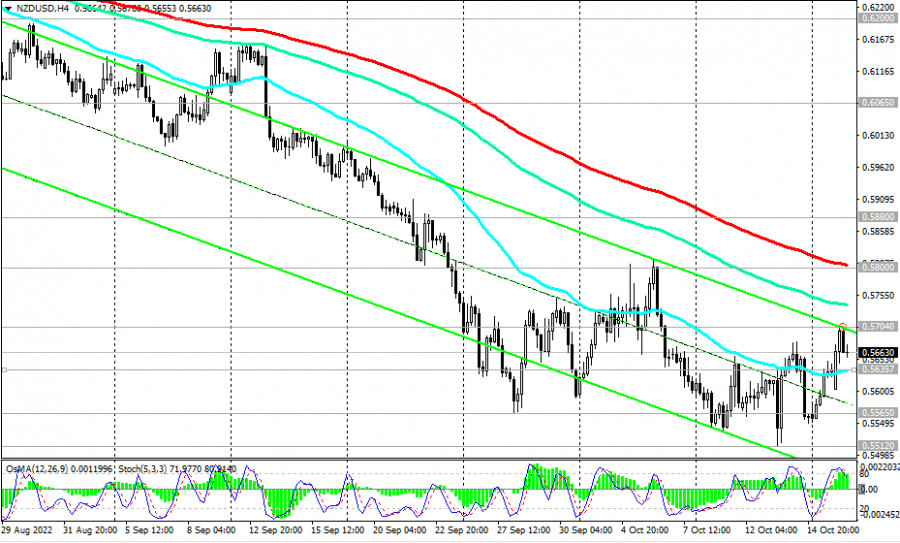
Today, NZD/USD half retains the bullish momentum gained from the inflation data in New Zealand that exceeded the forecast, while also trying to stay in the zone above the short-term important support level of 0.5635 (200 EMA on the 1-hour chart). As of writing, the pair is trading near the 0.5662 mark. It is characteristic that the OsMA and Stochastic technical indicators paint a contradictory picture: on the daily and weekly charts they turn to long positions, and on the 1-hour and 4-hour charts they turn to short positions, signaling the end of the upward correction.
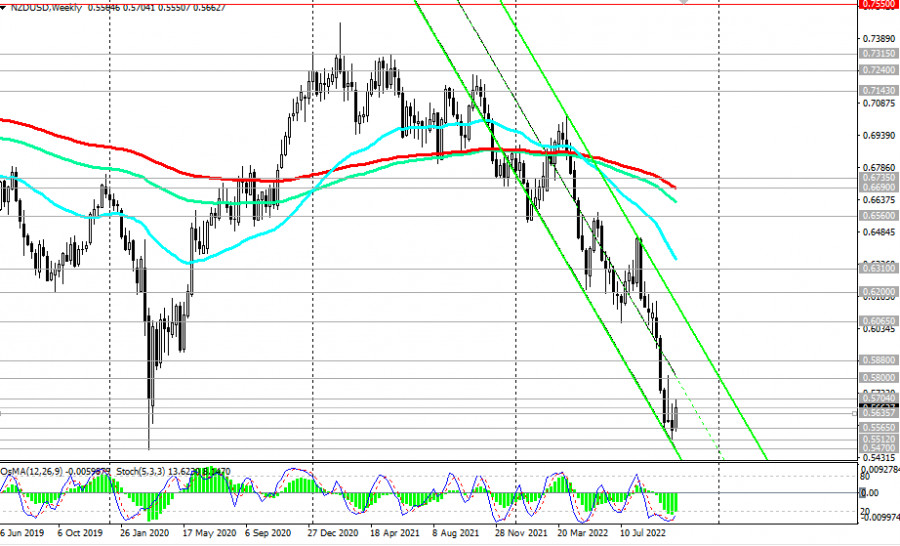
The signal for the resumption of sales will be a breakdown of the support level of 0.5635. In this case, NZD/USD will head deeper into the descending channel on the weekly chart and towards 0.5470.
In an alternative scenario, the upward correction will continue to the resistance levels of 0.5800 (200 EMA on the 4-hour chart), 0.5880 (50 EMA on the daily chart).
In general, the downward dynamics of NZD/USD prevails, while the pair remains in the zone of a long-term bear market—below the key resistance levels of 0.6690 (200 EMA on the weekly chart), 0.6310 (200 EMA on the daily chart). Only their breakdown will bring the pair back into the zone of a long-term bull market.
And today, the volatility in the NZD/USD pair may increase again (in the period after 13:15 - 14:00 GMT), which will be associated with the publication of macro statistics for the US and New Zealand, as well as at 21:30 during the speech of Fed representative Neel Kashkari.
Support levels: 0.5635, 0.5600, 0.5565, 0.5512, 0.5470
Resistance levels: 0.5704, 0.5800, 0.5880, 0.6065, 0.6200, 0.6310, 0.6560, 0.6690, 0.6735
Trading Tips
Sell Stop 0.5620. Stop-Loss 0.5710. Take-Profit 0.5600, 0.5565, 0.5512, 0.5470
Buy Stop 0.5710. Stop-Loss 0.56250. Take-Profit 0.5800, 0.5880, 0.6065, 0.6200, 0.6310, 0.6560, 0.6690, 0.6735
You have already liked this post today
*تعینات کیا مراد ہے مارکیٹ کے تجزیات یہاں ارسال کیے جاتے ہیں جس کا مقصد آپ کی بیداری بڑھانا ہے، لیکن تجارت کرنے کے لئے ہدایات دینا نہیں.
منگل کی تجارت کا تجزیہ برطانوی پاؤنڈ/امریکی ڈالر کا 1 گھنٹے کا چارٹ منگل کو برطانوی پاؤنڈ/امریکی ڈالر جوڑی میں نمایاں کمی واقع ہوئی۔ جب کہ پاؤنڈ کی گراوٹ
جمعہ کو، برطانوی پاؤنڈ/امریکی ڈالر کے جوڑے نے انتہائی کم اتار چڑھاؤ کا مظاہرہ کیا، پھر بھی برطانوی پاؤنڈ مارکیٹ کے اس طرح کے حالات کے باوجود مسلسل اوپر
جمعرات کی تجارت کا تجزیہ برطانوی پاؤنڈ/امریکی ڈالر کا 1 گھنٹے چارٹ برطانوی پاؤنڈ/امریکی ڈالر کی جوڑی جمعرات بھر میں زیادہ تجارت کرتی رہی۔ یہاں تک کہ اپنی بلند ترین
انسٹا فاریکس کلب

Your IP address shows that you are currently located in the USA. If you are a resident of the United States, you are prohibited from using the services of InstaFintech Group including online trading, online transfers, deposit/withdrawal of funds, etc.
If you think you are seeing this message by mistake and your location is not the US, kindly proceed to the website. Otherwise, you must leave the website in order to comply with government restrictions.
Why does your IP address show your location as the USA?
Please confirm whether you are a US resident or not by clicking the relevant button below. If you choose the wrong option, being a US resident, you will not be able to open an account with InstaTrade anyway.
We are sorry for any inconvenience caused by this message.


