یہ بھی دیکھیں


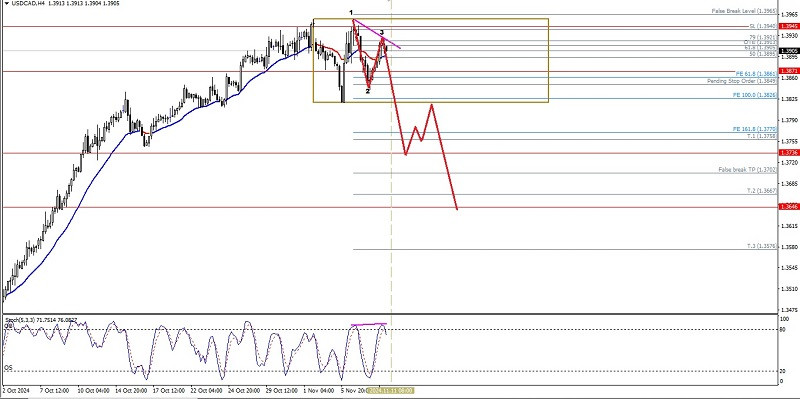
Although the condition of USD/CAD on the 4-hour chart is seen moving in a Sideways condition where this can be seen from the movement of EMA 21 which moves between the Candlestick bodies, but with the appearance of hidden deviations between price movements and the Stochastic Oscillator indicator and the appearance of the Bearish 123 pattern confirms that in the near future as long as there is no strengthening that breaks through the 1.3965 level, it will bring The Lonnie down to the 1.3850 level. If this level is successfully broken below, then USD/CAD has the potential to continue its weakening to the 1.3778 level and if the momentum and volatility support it, then 1.3667 will be the next target to be targeted if the momentum and volatility support it.
(Disclaimer)
You have already liked this post today
*تعینات کیا مراد ہے مارکیٹ کے تجزیات یہاں ارسال کیے جاتے ہیں جس کا مقصد آپ کی بیداری بڑھانا ہے، لیکن تجارت کرنے کے لئے ہدایات دینا نہیں.


