Lihat juga
The dollar plummeted on Wednesday, with its DXY index dropping by about 50 pips. It extended losses in early trade today, accompanied by a decline in US Treasury yields.
Markets are anticipating a rate cut from the Fed, despite Jerome Powell's virtually neutral rhetoric and warnings from other Fed officials about excessive expectations regarding monetary policy easing by the US central bank.
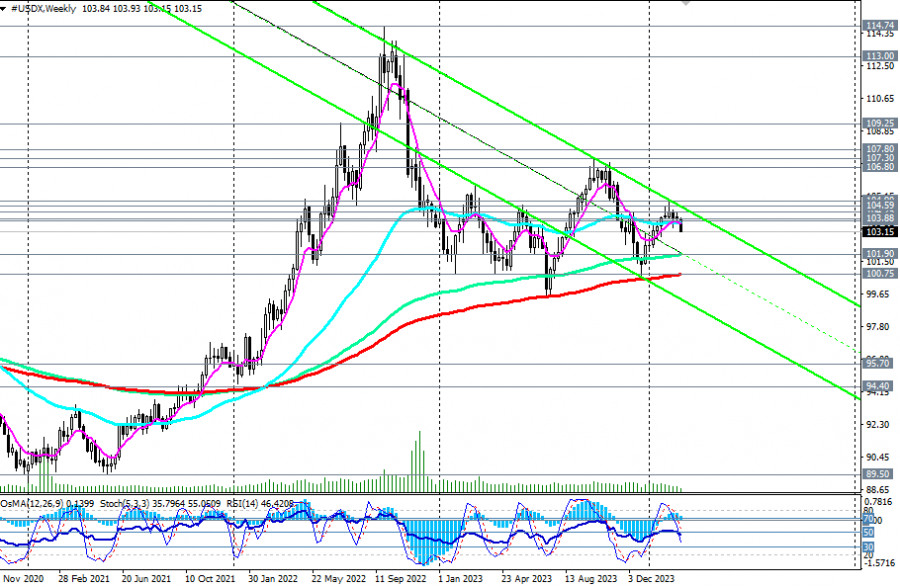
From a technical point of view, the US dollar index (CFD #USDX on the MT4 platform) is deepening within a downward channel on the weekly chart, heading towards the key support level of 100.75 (200-period moving average on the weekly chart), which separates the long-term bull market from the bear one.
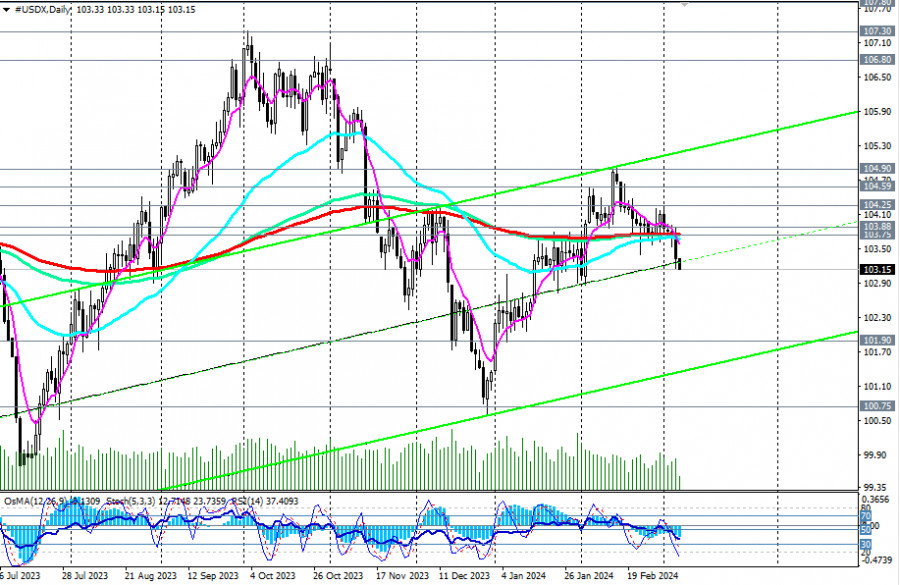
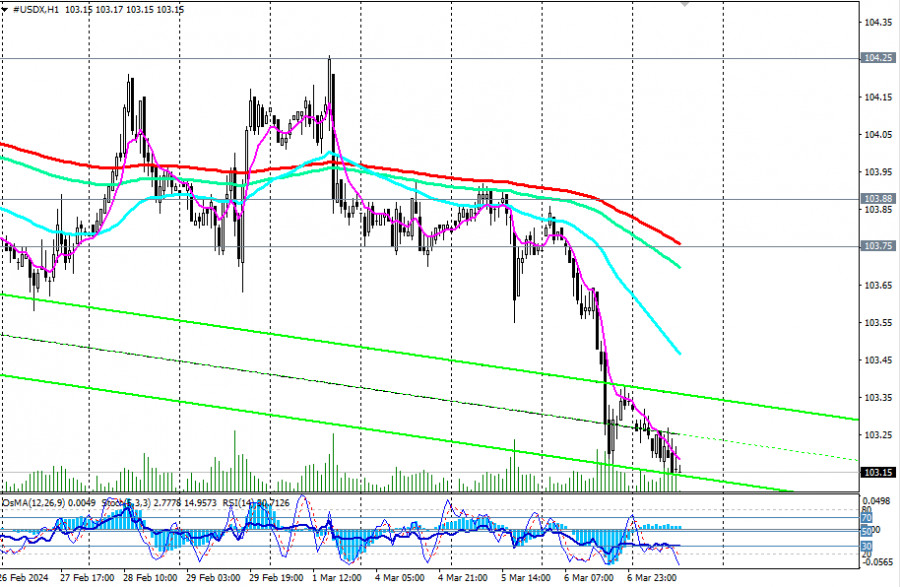
In the medium term, with the breach of the key support level of 103.75 (EMA200 on the daily chart), and in the short term, the US dollar index has already moved into the bear market zone. If the price breaks through the 103.00 mark, the index could decline to the support levels of 101.90, 100.75, and 100.00. Further developments will depend on the situation. In the meantime, the best way to make a profit is to open short positions.
In an alternative scenario, a decline to the 103.00 mark will bring dollar buyers back into the market. In case of a breakout of the resistance levels of 103.75 (EMA200 on 1-hour, 4-hour, daily charts) and 103.88, a buy signal will be generated. A breakout of the local resistance levels at 104.90 and 105.00 could revive the dollar's long-term bullish trend. In this case, the index is expected to head towards the October highs and the marks of 106.50, 106.80, 107.00, and 107.30.
This scenario will be relevant if tomorrow's US Department of Labor report turns out stronger than expected, and fresh data to be released on Tuesday indicate rising inflation.
The further dynamics of the dollar and its DXY index will largely depend on fundamental factors and the Fed's policy steps.
*) see InstaTrade trading indicators for USDX
Support levels: 103.00, 102.00, 101.90, 101.00, 100.75, 100.00
Resistance levels: 103.75, 103.88, 104.00, 104.25, 104.59, 104.90, 105.00, 106.00, 106.80, 107.00, 107.30
Trading scenarios
Alternative scenario: Buy Stop 103.40. Stop-Loss 103.00. Targets 103.75, 103.88, 104.00, 104.25, 104.59, 104.90, 105.00, 106.00, 106.80, 107.00, 107.30
Main scenario: Sell Stop 103.10. Stop-Loss 103.40. Targets 103.00, 102.00, 101.90, 101.00, 100.75, 100.00
*) "Targets" correspond to support/resistance levels. This does not necessarily mean they will be reached, but they can serve as a guide in planning and placing your trading positions.
You have already liked this post today
* Analisis pasaran yang disiarkan di sini adalah bertujuan untuk meningkatkan kesedaran anda, tetapi tidak untuk memberi arahan untuk membuat perdagangan.
Analisis Dagangan Hari Khamis Carta 1 Jam pasangan GBP/USD Pasangan GBP/USD meneruskan dagangan dalam arah menaik pada hari Khamis meskipun tiada sebarang alasan objektif yang jelas untuk pergerakan tersebut. Tiada
Pada hari Khamis, pasangan mata wang EUR/USD didagangkan dengan sedikit kecenderungan menaik, walaupun akan lebih logik untuk melihat penurunan pada separuh kedua hari itu. Tiada peristiwa, laporan, atau pengumuman penting
Analisis 5-Minit pasangan GBP/USD Pada hari Khamis, pasangan mata wang GBP/USD meneruskan dagangan dalam "gaya euro." Pergerakan harian agak lemah, dan gambaran teknikal menunjukkan trend mungkin akan beralih ke bawah
Pasangan mata wang EUR/USD didagangkan dengan lebih tenang pada hari Khamis berbanding pada separuh pertama minggu ini, dan pasaran juga lebih bersifat teknikal. Sejak awal minggu, kami terus mengulang mesej
Dalam ramalan saya pagi tadi, saya menekankan tahap 1.3293 dan merancang untuk menggunakannya sebagai rujukan untuk memasuki pasaran. Mari kita lihat carta 5-minit dan analisis apa yang berlaku. Penembusan
Dalam ramalan pagi, saya menumpukan kepada paras 1.1358 dan merancang untuk membuat keputusan dagangan berdasarkan paras tersebut. Mari kita lihat carta 5 minit untuk memahami apa yang berlaku. Pasangan mata
Pada hari Rabu, pasangan GBP/USD mengikuti rapat pergerakan EUR/USD, yang semakin mengesahkan bahawa keadaan semasa bergantung kepada dolar AS. Nasib dolar AS sepenuhnya bergantung kepada kehendak Donald Trump. Hampir semua
Analisis Dagangan Hari Rabu Carta 1-Jam pasangan EUR/USD Pada hari Rabu, pasangan mata wang EUR/USD diniagakan secara tidak menentu. Sepanjang hari, harga berubah arah beberapa kali dan data makroekonomi tidak
Pada hari Rabu, pasangan mata wang GBP/USD mengikuti aliran yang sama seperti pasangan mata wang EUR/USD. Pound British turut menjunam mendadak sepanjang malam selepas dua kenyataan daripada Donald Trump, kemudian
Analisis 5-Minit pasangan EUR/USD Pasangan mata wang EUR/USD diniagakan dalam kedua-dua arah sepanjang hari Rabu, sentiasa mengubah laluannya. Hari dagangan bermula dengan kejatuhan harga selepas Donald Trump mengumumkan bahawa beliau
Your IP address shows that you are currently located in the USA. If you are a resident of the United States, you are prohibited from using the services of InstaFintech Group including online trading, online transfers, deposit/withdrawal of funds, etc.
If you think you are seeing this message by mistake and your location is not the US, kindly proceed to the website. Otherwise, you must leave the website in order to comply with government restrictions.
Why does your IP address show your location as the USA?
Please confirm whether you are a US resident or not by clicking the relevant button below. If you choose the wrong option, being a US resident, you will not be able to open an account with InstaTrade anyway.
We are sorry for any inconvenience caused by this message.