empty
18.01.2022 12:54 PM
GBP/USD analysis on January 18, 2022. GBP down even though UK unemployment rate falls

This image is no longer relevant

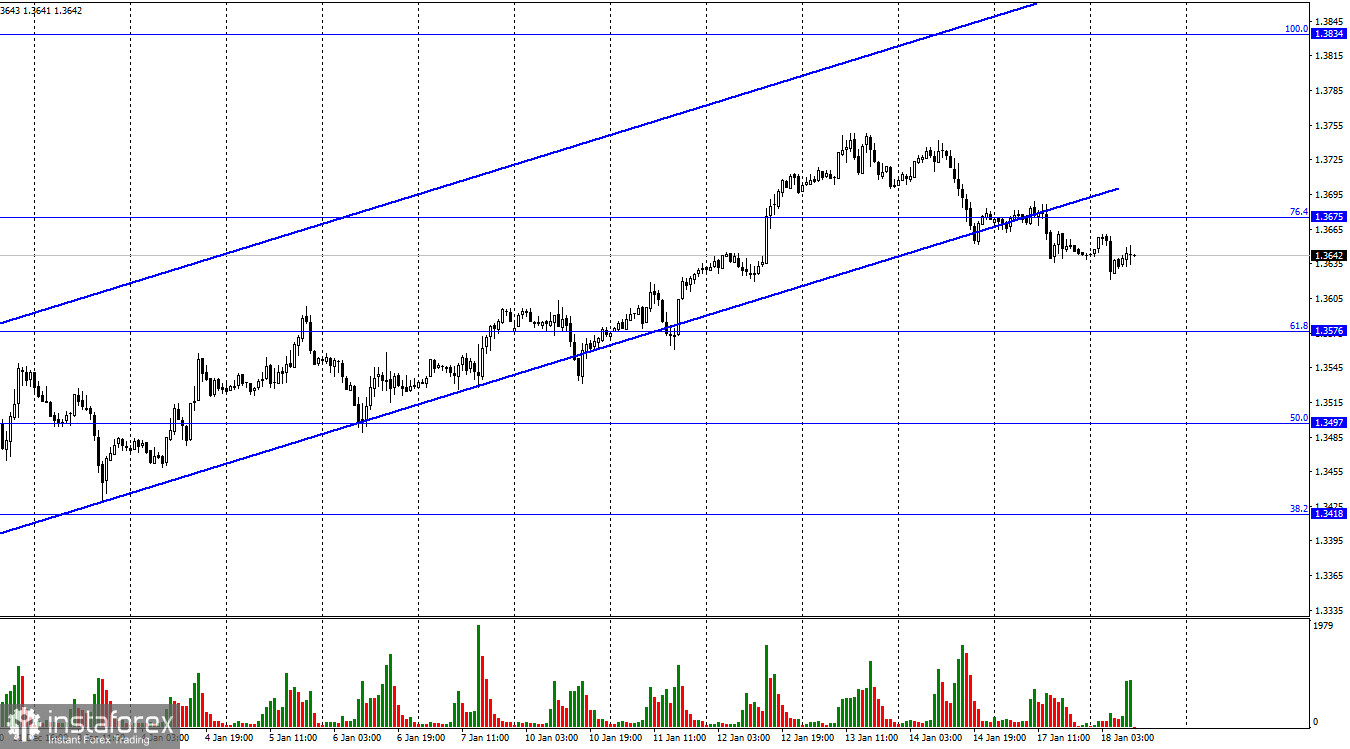
On the 1-hour chart, the GBP/USD pair closed below the 76.4% Fibonacci retracement level of 1.3675 and the ascending channel, which has long served as a confirmation of a bullish trend. However, the sentiment has changed to bearish, and the pair is now heading for the 61.8% Fibonacci retracement level of 1.3576. No other scenarios are possible at the moment. Meanwhile, the UK was the first to publish macroeconomic data this week. On Tuesday morning, three important reports were published. The unemployment rate fell to 4.1% from 4.2% in November. The number of initial jobless claims dropped by 43,000, while wages increased by 4.2%. All three reports either exceeded traders' expectations or met them. Surprisingly, instead of getting support, the British currency faced a sell-off wave. On Tuesday, it lost nearly 20 pips.

Apparently, traders have downplayed this important statistics from the UK. There are no more events in the economic calendar for today. This means that traders will have to rely entirely on technical analysis. The current technical picture fully confirms a new decline in the pound/dollar pair. Notably, this downtrend is likely to continue for a week or two. The fall may last at least until the Fed's meeting next week. How can the US regulator influence the markets? I think that this meeting will become a bearish factor for the pair. The US central bank is expected to double the pace of tapering its monthly bond purchases in January to $30 billion, but it will hardly raise the interest rate this time. So, the US dollar may receive moderate support. The meeting of the Bank of England will be of more importance to the pound as it may surprise investors with another rate hike. However, the UK regulator is unlikely to raise the rate for the second month in a row.

This image is no longer relevant

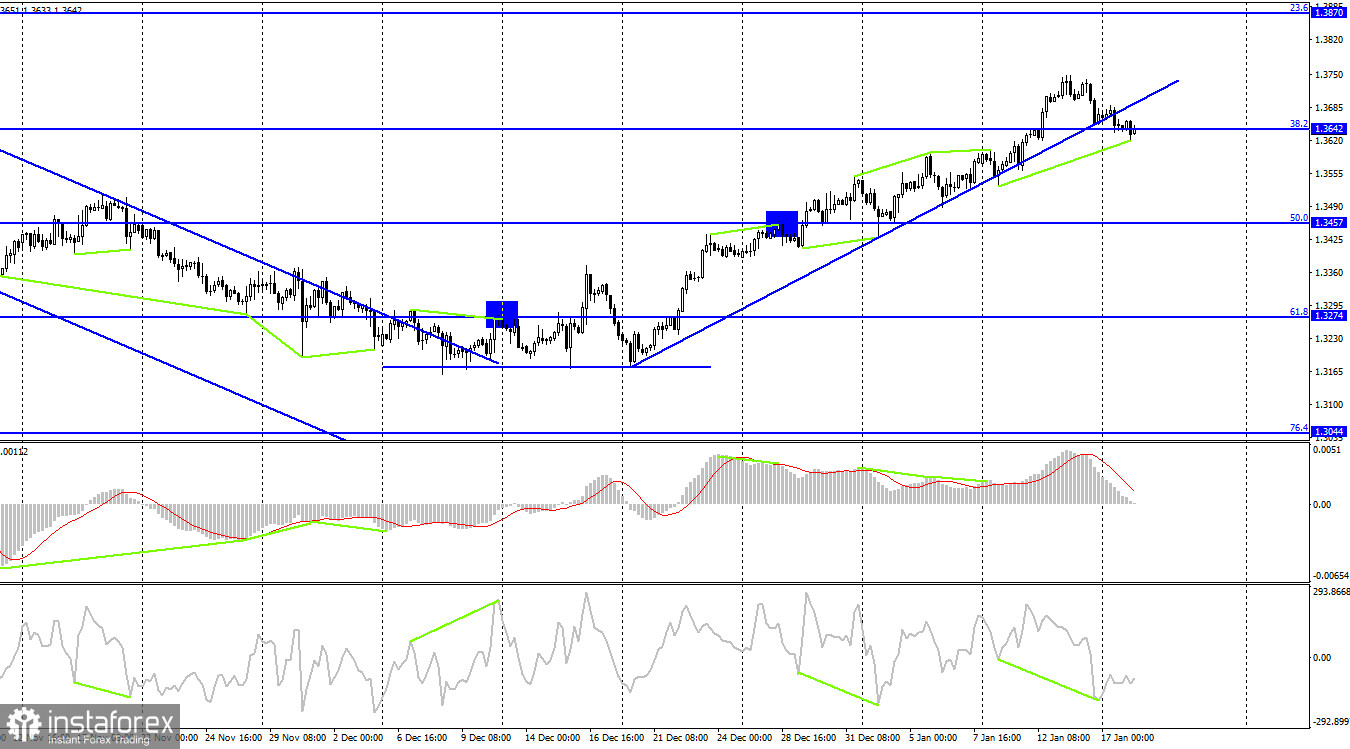
On the 4H time frame, the pair consolidated below a key trendline which has been acting as resistance for quite a long time. The price is likely to keep falling. However, we can see that a bullish divergence has been formed near the CCI indicator. This divergence hints at a possible upside movement of the pair. But I still believe that the price will extend its decline towards the 50.0% Fibonacci retracement level of 1.3457. A clear close below the 38.2% Fibonacci level of 1.3642 will confirm the continuation of a downtrend.

Economic calendar for US and UK:

UK – Claimant Count Change (07-00 UTC).

UK – Unemployment rate (07-00 UTC).

UK – Average Earnings (07-00 UTC). On Tuesday, all reports have already been published without any significant impact on the market. As for the US, there are no significant reports today. Therefore, the information background will be weak for the rest of the day.

GBP/USD forecast and trading tips:

I recommend selling the pound when the price closes below the ascending trendline on the 4-hour chart with the target at 1.3497. For now, you can keep these positions open. I would not advise you to buy the pound as the pair may have just started to develop a new descending trend.

Recommended Stories

USD/JPY – Ringkasan dan Prospek

Minggu lepas, pasaran mencatat paras terendah baru, tetapi penjual gagal meneruskan pergerakan turun sepenuhnya. Ini mungkin terjadi kerana paras terendah minggu sebelumnya (141.63) disokong oleh paras sokongan bulanan (141.96). Akibatnya

Evangelos Poulakis 03:51 2025-04-28 UTC+2

Isyarat Dagangan untuk EMAS (XAU/USD) bagi 25-29 April, 2025: beli di atas $3,270 (21 SMA - pantulan semula)

Pada awal sesi Amerika, emas sedang didagangkan sekitar 3,276 dengan tekanan menurun selepas mengalami rintangan kuat sekitar 3,270, tahap yang bertepatan dengan penarikan semula Fibonacci 38.2%. Emas kini mungkin mencapai

Dimitrios Zappas 18:02 2025-04-25 UTC+2

Isyarat Dagangan EUR/USD untuk 24-26 April 2025: jual di bawah 1.1435 (21 SMA - 7/8 Murray)

Pada awal sesi dagangan Amerika, pasangan EUR/USD didagangkan sekitar paras 1.1358 dalam saluran menurun yang terbentuk sejak 18 April. Pasangan ini masih berada di bawah tekanan menurun. Kami berpendapat instrumen

Dimitrios Zappas 17:06 2025-04-24 UTC+2

EMAS. Harga Emas Berkemungkinan Menyusut Dengan Ketara Dalam Masa Terdekat

Harga emas baru-baru ini mengalami pembetulan yang ketara berikutan jangkaan pasaran terhadap permulaan rundingan sebenar antara Amerika Syarikat dan China berhubung tarif serta perdagangan secara keseluruhan. Kenyataan Setiausaha Perbendaharaan

Pati Gani 09:38 2025-04-24 UTC+2

Analisis Teknikal Pergerakan Harga Instrumen Komoditi Perak, Khamis 24 April 2025.

Pada carta 4 jam, instrumen komoditi Silver kelihatan meskipun keadaannya mengukuh di mana ini disahkan oleh pergerakan harga Silver yang bergerak di atas WMA (30 Shift 2) yang juga mempunyai

Arief Makmur 06:18 2025-04-24 UTC+2

Analisis Teknikal Pergerakan Harga Indeks Nasdaq 100, Khamis 24 April 2025.

Walaupun pada carta 4 jam indeks Nasdaq 100 berada dalam keadaan mendatar (Sideways), julat pergerakannya masih cukup luas, sekali gus menawarkan peluang yang agak menarik pada indeks ini. Ketika

Arief Makmur 06:18 2025-04-24 UTC+2

Isyarat Dagangan untuk EMAS (XAU/USD) bagi 23-25 April, 2025: jual di bawah $3,333 (200 EMA - 6/8 Murray)

Rancangan dagangan kami untuk beberapa jam akan datang adalah menjual emas di bawah $3,333, dengan sasaran pada $3,313 dan $3,291. Kami boleh membeli di atas $3,280 dengan sasaran jangka pendek

Dimitrios Zappas 14:31 2025-04-23 UTC+2

Analisis Teknikal Pergerakan Harga Harian Pasangan Mata Wang Silang AUD/JPY, Rabu, 23 April 2025.

Dengan kemunculan Divergence antara pergerakan harga pasangan mata wang silang AUD/JPY dengan penunjuk Pengayun Stochastic dan pergerakan harga AUD/JPY yang berada di atas WMA (30 Shift 2) yang juga mempunyai

Arief Makmur 06:37 2025-04-23 UTC+2

Analisis Teknikal Pergerakan Harga Intraday Instrumen Komoditi Emas, Rabu, 23 April 2025.

Jika kita melihat carta 4 jam, instrumen komoditi Emas masih menunjukkan kecenderungan Menaik, namun kemunculan Perbezaan (Divergence) antara pergerakan harga Emas dan penunjuk Pengayun Stochastic memberi isyarat bahawa dalam masa

Arief Makmur 06:37 2025-04-23 UTC+2

Analisis Teknikal Pergerakan Harga Intraday Pasangan Mata Wang Bersilang GBP/CHF, Selasa 22 April 2025.

Jika kita meneliti carta 4 jam bagi pasangan silang mata wang GBP/CHF, terdapat beberapa fakta menarik. Pertama sekali, kemunculan corak Segitiga yang diiringi oleh purata bergerak eksponen EMA (21) yang

Arief Makmur 06:58 2025-04-22 UTC+2
Tidak boleh bertanya sekarang?
Tanya soalan anda di Ruangan bersembang.