Lihat juga
According to the latest COT report on 08.25.20, open interest in the euro remained around the same level, which only shows a slight increase (704077 against 704050). At the same time, the net positions of the main market participants were increased. In the Non-Commercial group, the frequency of long positions over short ones was 5 and a half times, the net position here is equal to 211752 (+14809). This result was achieved by actively reducing short positions (long +2817 and short -11992). On the other hand, short positions in the Commercial group are still taking the lead, having more advantage. The net position also showed a general growth (+8618), which is equal to 267982. Since there is a certain parity between the groups of large players, the total position now retains a slight advantage (only 8%) of short positions.
The main conclusion
The trend continues. The leadership of long positions in the group responsible for the current trend (Non-Commercial) is mainly achieved by reducing the opponent's positions, so the pair has not yet managed to achieve a clear bullish impulse.
Technical picture
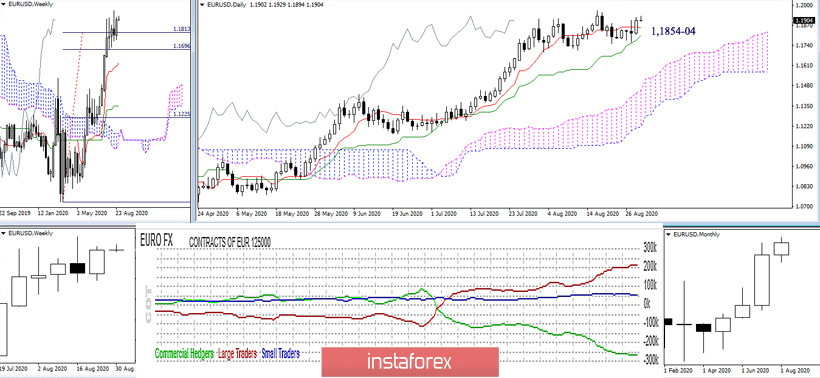
In technical terms, there is work in the correction zone. The strength and influence of the supports (1.1813 - 1.1740 - 1.1695) continue to limit the development of the downward correction. The lines of the day cross are closing the gap, which can provoke a change in the direction of the cross in the near future, and therefore, the overall daily priorities. The daily Ichimoku Cross supports are located at 1.1854-04 today. As long as the euro is above the cross, the majority of forces is on the side of the upside, while the weakening factor is the pair's presence in the zone of the downward correction. The nearest upward reference is now the maximum extremum (1.1966), then the interests of the bulls will be directed towards the rise to the upper border of the monthly cloud (1.2167).
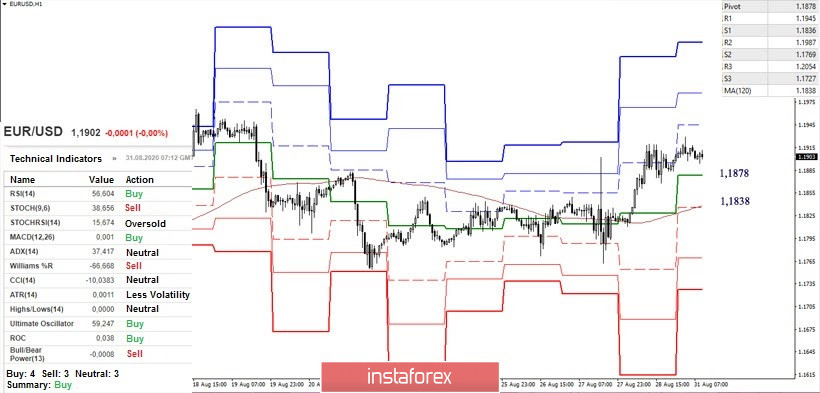
In the lower halves, the advantage belongs to the players to increase. The classic pivot levels are located at 1.1945 - 1.1987 - 1.2054, which serve as pivots within the day. On the other hand, the key supports are found at 1.1878 (central pivot level) and 1.1838 (weekly long-term trend). A consolidation below will change the balance of forces and will lead the pair to the support zone of the daily cross (1.1854-04). If the daily supports breaks down and firmly consolidates below, the balance of forces already on the daily time frame will change. Now, after passing the key supports of this section (1.1813 - 1.1740 - 1.1695), a weekly downward correction can be expected.
Ichimoku Kinko Hyo (9.26.52), Pivot Points (Classic), Moving Average (120)
You have already liked this post today
* Analisis pasaran yang disiarkan di sini adalah bertujuan untuk meningkatkan kesedaran anda, tetapi tidak untuk memberi arahan untuk membuat perdagangan.
Pada awal sesi dagangan Amerika, pasangan EUR/USD didagangkan sekitar paras 1.1358 dalam saluran menurun yang terbentuk sejak 18 April. Pasangan ini masih berada di bawah tekanan menurun. Kami berpendapat instrumen
Harga emas baru-baru ini mengalami pembetulan yang ketara berikutan jangkaan pasaran terhadap permulaan rundingan sebenar antara Amerika Syarikat dan China berhubung tarif serta perdagangan secara keseluruhan. Kenyataan Setiausaha Perbendaharaan
Pada carta 4 jam, instrumen komoditi Silver kelihatan meskipun keadaannya mengukuh di mana ini disahkan oleh pergerakan harga Silver yang bergerak di atas WMA (30 Shift 2) yang juga mempunyai
Walaupun pada carta 4 jam indeks Nasdaq 100 berada dalam keadaan mendatar (Sideways), julat pergerakannya masih cukup luas, sekali gus menawarkan peluang yang agak menarik pada indeks ini. Ketika
Rancangan dagangan kami untuk beberapa jam akan datang adalah menjual emas di bawah $3,333, dengan sasaran pada $3,313 dan $3,291. Kami boleh membeli di atas $3,280 dengan sasaran jangka pendek
Dengan kemunculan Divergence antara pergerakan harga pasangan mata wang silang AUD/JPY dengan penunjuk Pengayun Stochastic dan pergerakan harga AUD/JPY yang berada di atas WMA (30 Shift 2) yang juga mempunyai
Jika kita melihat carta 4 jam, instrumen komoditi Emas masih menunjukkan kecenderungan Menaik, namun kemunculan Perbezaan (Divergence) antara pergerakan harga Emas dan penunjuk Pengayun Stochastic memberi isyarat bahawa dalam masa
Jika kita meneliti carta 4 jam bagi pasangan silang mata wang GBP/CHF, terdapat beberapa fakta menarik. Pertama sekali, kemunculan corak Segitiga yang diiringi oleh purata bergerak eksponen EMA (21) yang
Dengan pergerakan harga pasangan mata wang silang AUD/CAD bergerak di atas WMA (21) yang mempunyai cerun menaik dan penampilan Konvergensi antara pergerakan harga AUD/CAD dan penunjuk Pengayun Stochastic, ia memberikan
Penunjuk eagle telah mencapai tahap terlebih beli. Walau bagaimanapun, logam tersebut masih boleh mencapai paras tinggi sekitar 8/8 Murray, yang mewakili rintangan kuat untuk emas. Di bawah kawasan ini, kita
Your IP address shows that you are currently located in the USA. If you are a resident of the United States, you are prohibited from using the services of InstaFintech Group including online trading, online transfers, deposit/withdrawal of funds, etc.
If you think you are seeing this message by mistake and your location is not the US, kindly proceed to the website. Otherwise, you must leave the website in order to comply with government restrictions.
Why does your IP address show your location as the USA?
Please confirm whether you are a US resident or not by clicking the relevant button below. If you choose the wrong option, being a US resident, you will not be able to open an account with InstaTrade anyway.
We are sorry for any inconvenience caused by this message.