यह भी देखें


 20.01.2023 11:38 AM
EUR/USD
Larger timeframes
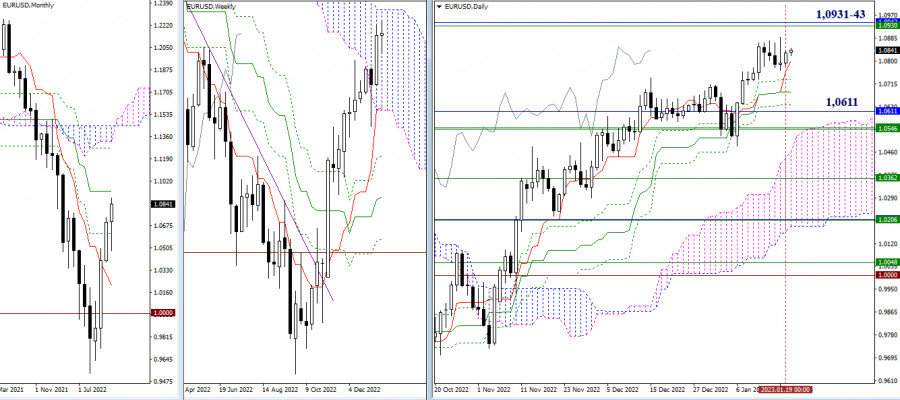
The trading week is coming to an end, but none of the sides in EUR/USD has asserted itself. The currency pair is consolidating with uncertain prospects. The nearest upward target remains at the convergence area between the upper border of a one-week cloud (1.0931) and a one-month medium-term trend line (1.0943). Support is still represented by the levels of the daily Ichimoku cross such as 1.0799 – 1.0733 – 1.0685 – 1.0637, a one-month support at 1.061 and a one-week support of 1.0546-55.
H4 – H1
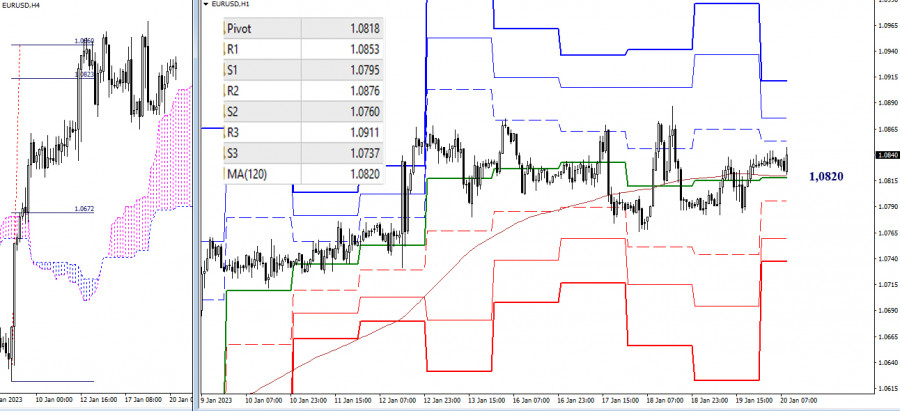
On smaller time frames, the bulls are still holding the upper hand. They managed to return and settle the price above the key support of 1.0818-20, embracing the central pivot level + a one-week long-term trend line. If the bulls exert their influence and extend a rally, the instrument will face resistance at the classical pivot levels of 1.0853 – 1.0876 – 1.0911. Otherwise, if the bears take the lead, the price will head for support at the classical pivot levels of 1.0795 – 1.0760 – 1.0737.
***
GBP/USD
Larger time frames
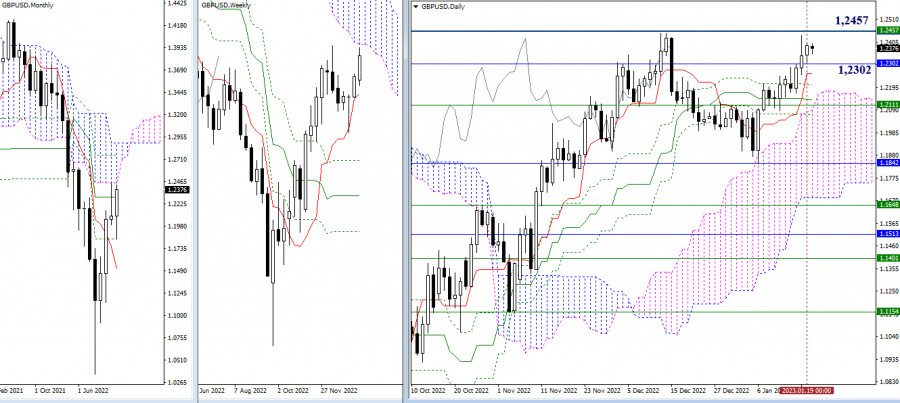
On the daily time frame, GBP/USD settled above a one-month medium-term trend line at 1.2302. As a result, the level of 1.2457, which represents the upper border of the Ichimoku clouds on the one-month and one-week time frames, serves as the key resistance. If the level is surpassed, the bulls will reinforce their influence.
H4 – H1
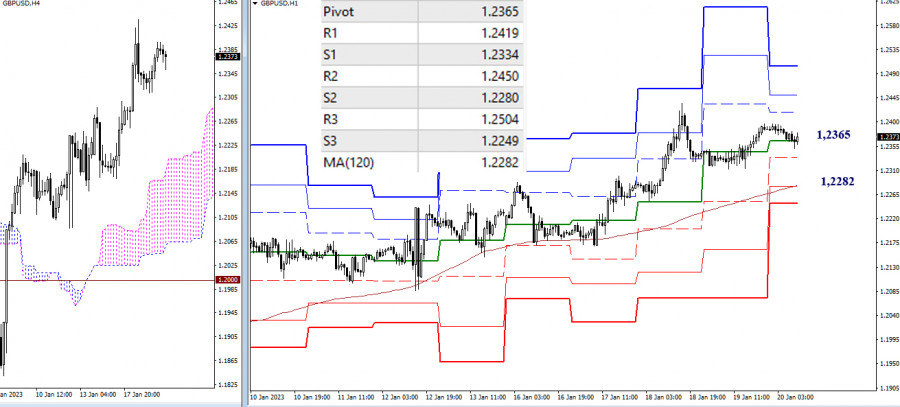
On smaller time frames, the intraday central pivot level of 1.2365 is being tested. The next downward crucial target within the downward correction is seen at the support of 1.2282. Once this level is surpassed, the current balance of trading forces will change. When the downward correction is over, the focus will be shifted again toward upward targets at 1.2419 – 1.2450 – 1.2504 which act as the resistance of the classic pivot levels.
***
This technical analysis is based on the following ideas:
Larger timeframes - Ichimoku Kinko Hyo (9.26.52) + Fibo Kijun levels
H1 – classic pivot points + 120-period Moving Average (weekly long-term trendline)
You have already liked this post today
*यहां पर लिखा गया बाजार विश्लेषण आपकी जागरूकता बढ़ाने के लिए किया है, लेकिन व्यापार करने के लिए निर्देश देने के लिए नहीं |


