Lihat juga
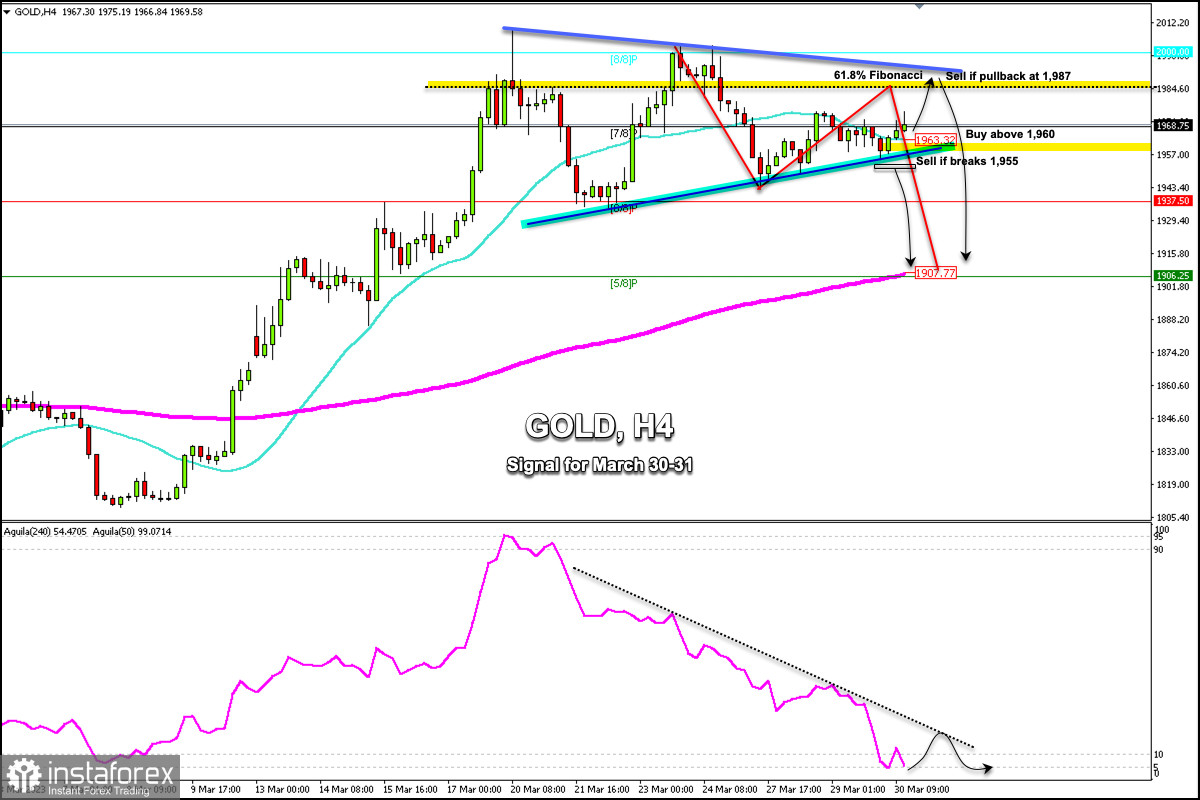
Early in the American session, Gold (XAU/USD) is trading around 1,968 above 7/8 Murray and above the 21 SMA located at 1,963.32.
According to the 4-hour chart, we can see that gold is making a technical rebound after falling from the high of 2,003.21 to the low of 1,943.86.
This movement could mean a correction towards the 61.8% Fibonacci, located around 1,984. A pullback towards this area could be a sign for gold to resume its bearish cycle and it could reach the 200 EMA located at 1,907 in the next few days.
XAU/USD is currently trading above the 21 SMA located at 1,963 which favors a bullish movement. If it consolidates above this level, it could continue to rise until it reaches 1,975 and 1,987.
A pullback to the resistance zone of the downtrend channel formed between the high of 2009 and 2003 could be a point to sell around 1,987, with targets at 1,950 and 1,907 (200 EMA).
For gold to resume its bullish cycle, we should expect a sharp break above 1,990 and consolidation above 8/8 Murray (2000). Then, the metal could reach +1/8 Murray located at 2,031.25.
Conversely, for gold to turn more bearish, it will need to break the bottom of the uptrend channel formed between the low of 1,934 and 1,943. Then, it could reach 1,937 (6/8 Murray) and 1,907 (200 EMA).
The Eagle indicator has reached the extremely oversold zone around 5 points which is likely to be followed by any technical bounce. As long as it does not break its pressure line, it could be a signal to sell.
You have already liked this post today
*Analisis pasar yang diposting disini dimaksudkan untuk meningkatkan pengetahuan Anda namun tidak untuk memberi instruksi trading.
Pada sesi Amerika awal, pasangan EUR/USD diperdagangkan di sekitar 1,1358 dalam saluran tren turun yang terbentuk pada 18 April. Pasangan ini berada di bawah tekanan bearish. Kami percaya instrumen
Harga emas belakangan ini mengalami koreksi yang signifikan di tengah ekspektasi pasar akan dimulainya negosiasi nyata antara AS dan Tiongkok mengenai tarif dan perdagangan secara keseluruhan. Pernyataan Menteri Keuangan
Meski di chart 4 jamnya indeks Nasdaq 100 tengah Sideways, namun kisarannya cukup besar sehingga masih ada peluang yang cukup menjanjikan di indeks tersebut. Saat ini indikator Stochastic Oscillator tengah
Pada chart 4 jamnya, instrument komoditi Perak nampak terlihat meski kondisinya tengah menguat di mana hal ini terkonfirmasi oleh pergerakan harga Perak yang bergerak diatas WMA (30 Shift 2) yang
Rencana trading kami untuk beberapa jam ke depan adalah menjual emas di bawah $3.333, dengan target di $3.313 dan $3.291. Kami dapat membeli di atas $3.280 dengan target jangka pendek
Dengan munculnya Divergence antara pergerakan harga pasangan mata uang silang AUD/JPY dengan indikator Stochastic Oscillator serta pergerakan harga AUD/JPY yang berada diatas WMA (30 Shift 2) yang juga memiliki kemiringan
Bila Kita perhatikan pada chart 4 jamnya, instrumen komoditi Emas nampak terlihat masih bergerak dalam bias yang Bullish, namun dengan kemunculan Divergence antara pergerakan harga Emas dengan indikator Stochastic Oscillator
Dengan pergerakan harga pasangan mata uang silang AUD/CAD yang bergerak diatas WMA (21) yang memiliki kemiringan yang menukik keatas serta munculnya Convergence antara pergerakan harga AUD/CAD dengan indikator Stochastic Oscillator
Bila Kita perhatikan chart 4 jam dari pasangan mata uang silang GBP/CHF, maka nampak ada beberapa fakta-fakta yang menari. Pertama, munculnya pola Triangle yang diikuti oleh pergerakan EMA (21)-nya yang
Indikator eagle telah mencapai level overbought. Namun, logam ini masih bisa mencapai level tinggi di sekitar 8/8 Murray, yang merupakan penghalang kuat bagi emas. Di bawah area ini, kita bisa
Indikator pola
grafis.
Lihat hal-hal
yang belum pernah anda lihat!
Klub InstaTrade
Your IP address shows that you are currently located in the USA. If you are a resident of the United States, you are prohibited from using the services of InstaFintech Group including online trading, online transfers, deposit/withdrawal of funds, etc.
If you think you are seeing this message by mistake and your location is not the US, kindly proceed to the website. Otherwise, you must leave the website in order to comply with government restrictions.
Why does your IP address show your location as the USA?
Please confirm whether you are a US resident or not by clicking the relevant button below. If you choose the wrong option, being a US resident, you will not be able to open an account with InstaTrade anyway.
We are sorry for any inconvenience caused by this message.