Voir aussi
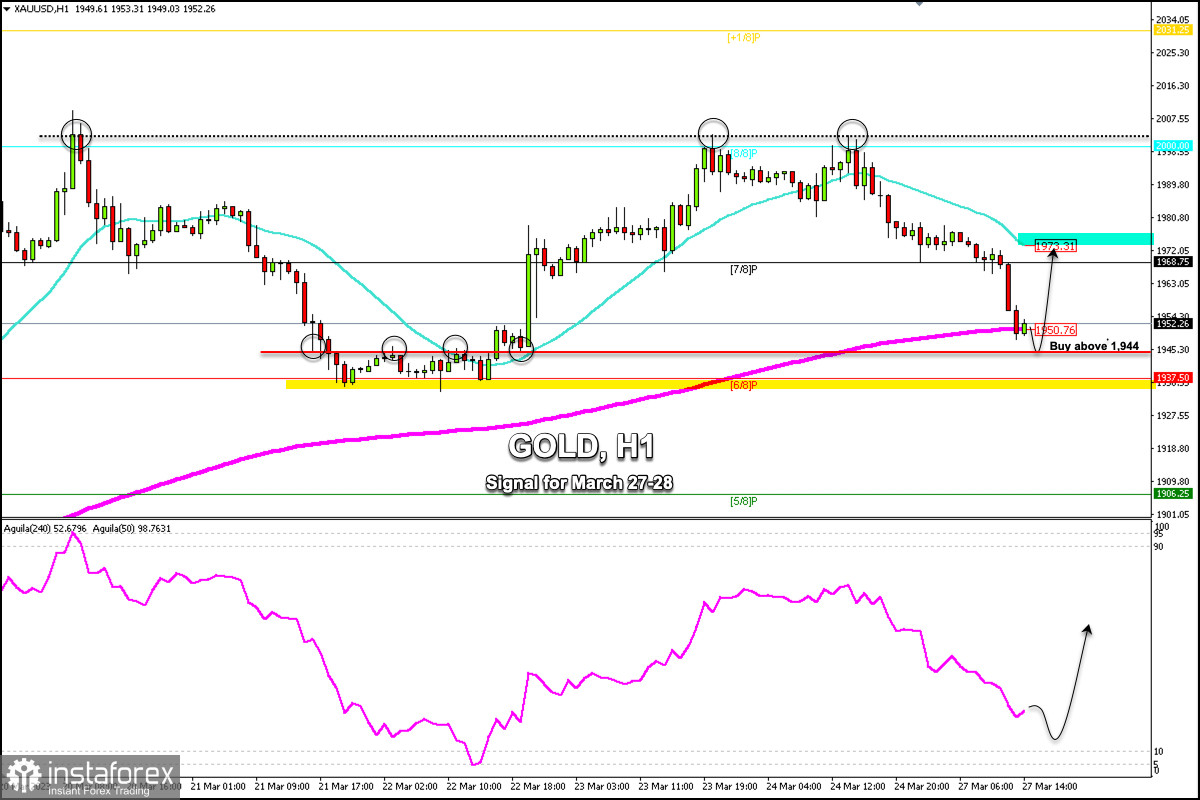
Early in the American session, Gold (XAU/USD) is trading around 1,952.26, above the 200 EMA, and below the 21 SMA located at 1,973. Since the opening of this trading week, gold has made a strong technical correction from the level of 1,979.38 towards 1,950. So, it has depreciated by almost $30.
According to the 1-hour chart, we can see that gold has found strong support around 1,944. In the past week, this level has turned out to be a key area of resistance and could now serve as a bottom, which could give the price a technical bounce and it could reach 1,968 (7/8 Murray) and finally the 21 SMA at 1,973.
Gold's average daily volatility is around 600 pips between rises and falls, which could indicate that the market is still nervous and investors are likely to continue to take refuge in gold.
If gold consolidates above 1,950 (200 EMA) in the next few hours, we could expect a rally and the metal could reach 1,968 and 1,973.
On the contrary, in case gold closes below 1,937, the scenario could change and the metal could resume a bearish trend and could reach 5/8 Murray located at 1,906 and finally reach the psychological level of 1,900.
The key will be to watch the 1,937 (6/8 Murray) and the 1,944 level, an area of strong support which could offer a technical bounce and an opportunity to resume buying. The eagle indicator is reaching the oversold zone and it is likely that any pullback has been seen as a signal to buy.
You have already liked this post today
*The market analysis posted here is meant to increase your awareness, but not to give instructions to make a trade.
Liens utiles : Mes autres articles sont disponibles dans cette section Cours InstaForex pour débutants Analytics Populaires Ouvrir un compte de trading Important : Les débutants en trading forex doivent
Tôt dans la session américaine, la paire EUR/USD se négocie autour de 1,1358 au sein du canal baissier formé le 18 avril. La paire est sous pression baissière. Nous pensons
Liens utiles : Mes autres articles sont disponibles dans cette section Cours InstaForex pour débutants Analytique Populaire Ouvrir un compte de trading Important : Les débutants dans le trading forex
Sur le graphique de 4 heures, l'instrument de la matière première argent est visible même si sa condition se renforce, ce qui est confirmé par le mouvement du prix
Bien que sur le graphique de 4 heures, l'indice Nasdaq 100 soit en phase latérale, la fourchette est assez large pour offrir une opportunité assez prometteuse. Actuellement, l'indicateur Stochastic Oscillator
Avec l'apparition d'une divergence entre le mouvement des prix de la paire de devises croisées AUD/JPY et l'indicateur Stochastic Oscillator, ainsi que le mouvement des prix de l'AUD/JPY
Si nous examinons le graphique de 4 heures, l'instrument de la commodité Or semble toujours évoluer dans un biais haussier, mais l'apparition d'une divergence entre le mouvement du prix
Liens utiles : Mes autres articles sont disponibles dans cette section Cours InstaForex pour débutants Analyses Populaires Ouvrir un compte de trading Important : Les débutants en trading forex doivent
Your IP address shows that you are currently located in the USA. If you are a resident of the United States, you are prohibited from using the services of InstaFintech Group including online trading, online transfers, deposit/withdrawal of funds, etc.
If you think you are seeing this message by mistake and your location is not the US, kindly proceed to the website. Otherwise, you must leave the website in order to comply with government restrictions.
Why does your IP address show your location as the USA?
Please confirm whether you are a US resident or not by clicking the relevant button below. If you choose the wrong option, being a US resident, you will not be able to open an account with InstaTrade anyway.
We are sorry for any inconvenience caused by this message.