See also


 15.04.2025 06:44 PM
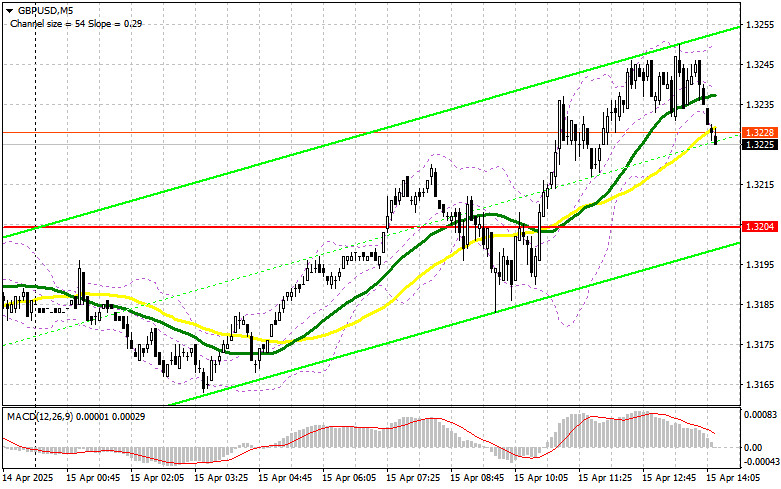
In my morning forecast, I focused on the 1.3204 level and planned to make trading decisions from it. Let's look at the 5-minute chart and see what happened. A breakout of 1.3204 occurred, but there was no proper setup for entering the market, so I ended up without any trades. The technical picture was revised for the second half of the day.
To open long positions on GBP/USD:
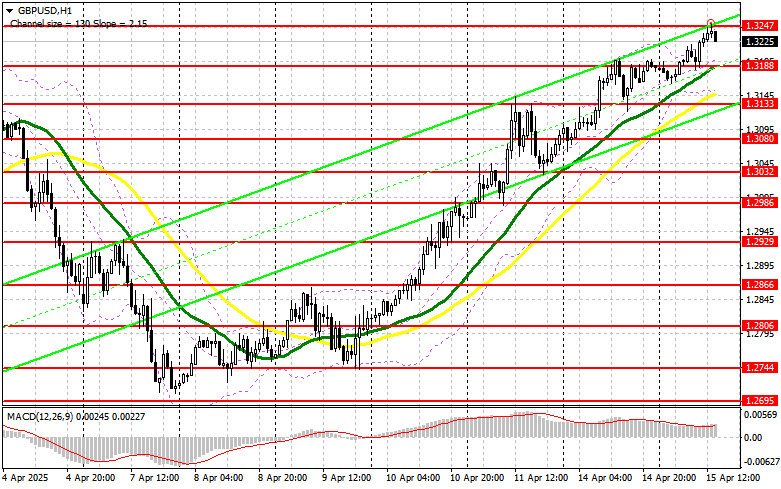
Due to mixed UK labor market data, the pound didn't immediately go up. The slower rise in jobless claims was offset by weak wage growth. In the second half of the day, we await U.S. Empire Manufacturing and Import Price Index data, which are unlikely to attract much interest from traders, so the pound's rally may continue. The best strategy is to act on a pullback. A false breakout around the 1.3188 support (formed during the first half of the day) would be enough to generate a good entry point for long positions with the goal of recovery to 1.3247 resistance. A breakout and retest of this range from top to bottom would provide another entry point for longs, targeting a move to 1.3301, further reinforcing the bullish trend. The ultimate target is 1.3344, where I plan to take profit.
If GBP/USD declines and there is no bullish activity around 1.3188 during the second half of the day, pressure on the pair will return. In this case, only a false breakout around 1.3133 will serve as a valid condition to open long positions. I also plan to buy GBP/USD on a rebound from 1.3080 support, targeting a 30–35 point intraday correction.
To open short positions on GBP/USD:
Sellers tried to capitalize on the mixed UK jobs data, but their efforts were weak. If GBP/USD continues rising during the U.S. session after the data release, only a false breakout at 1.3247 will provide an entry point for short positions, aiming for a drop to 1.3188 support. Slightly below this level lie the moving averages, so a breakout and retest from below will trigger stop-losses and open the way to 1.3133. The ultimate target is 1.3080, where I will take profit.
If demand for the pound persists in the second half of the day — which is more likely — and bears fail to appear at 1.3247, it's better to postpone selling until a test of 1.3301 resistance. I'll sell there only after a failed breakout. If there's no downside move from that level either, I'll look for short positions on a rebound from 1.3344, targeting a 30–35 point intraday correction.
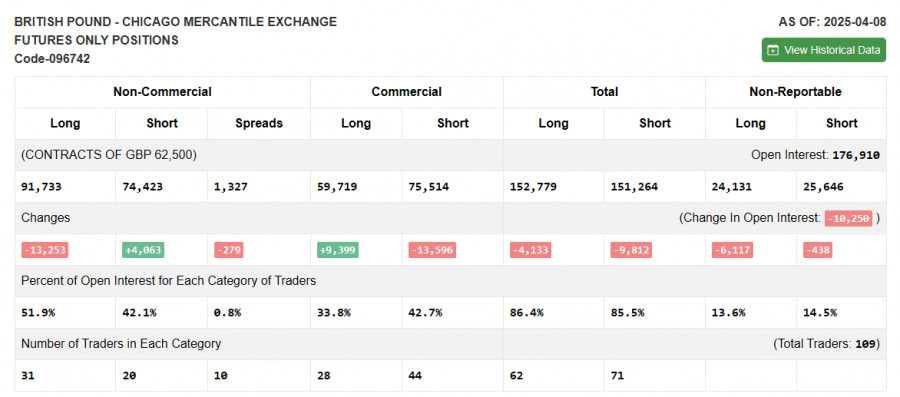
The COT (Commitment of Traders) report for April 8 showed a slight increase in short positions and a decrease in long positions. Notably, this report reflects Trump's decision to freeze tariffs for 90 days but doesn't account for the latest strong UK GDP growth data. Still, demand for the pound remains, as reflected in the report by the advantage of buyers over sellers.
Long non-commercial positions fell by 13,253 to 91,733 and short non-commercial positions increased by 4,063 to 74,423. As a result, the net long position decreased by 279.
Indicator Signals:
Moving Averages: Trading is above the 30- and 50-period MAs, indicating the continuation of the pair's upward trend.
Note: The moving average periods and price levels refer to the author's settings on the H1 chart and may differ from classic daily MAs on the D1 chart.
Bollinger Bands: The lower band around 1.3133 will act as support in case of a decline.
Indicator Descriptions:
You have already liked this post today
*The market analysis posted here is meant to increase your awareness, but not to give instructions to make a trade.
Analysis of Friday's Trades 1H Chart of GBP/USD On Friday, the GBP/USD pair showed extremely low volatility, yet the British pound steadily crept upward even with such market conditions
Analysis of Friday's Trades 1H Chart of EUR/USD The EUR/USD currency pair showed no movement on Friday. It was Good Friday, and Easter Sunday followed. As a result, many countries
The GBP/USD currency pair traded higher again on Friday, albeit with minimal volatility. Despite the lack of important events in the U.S. or the U.K. that day (unlike earlier
Analysis of Thursday's Trades 1H Chart of GBP/USD The GBP/USD pair continued to trade higher throughout Thursday. Even at its peak levels, the British pound shows no intention of correcting
Analysis of Thursday's Trades 1H Chart of EUR/USD The EUR/USD currency pair continued trading within a sideways channel on Thursday, as shown on the hourly timeframe chart above. The current
The GBP/USD currency pair continued its upward movement on Thursday, trading near multi-year highs. Despite the lack of significant events in the U.S. or the U.K. (unlike Wednesday), the market
The EUR/USD currency pair continued to trade sideways on Thursday. While previously it had been moving within a range between 1.1274 and 1.1391, on Thursday, it was stuck
InstaTrade
video analytics

Your IP address shows that you are currently located in the USA. If you are a resident of the United States, you are prohibited from using the services of InstaFintech Group including online trading, online transfers, deposit/withdrawal of funds, etc.
If you think you are seeing this message by mistake and your location is not the US, kindly proceed to the website. Otherwise, you must leave the website in order to comply with government restrictions.
Why does your IP address show your location as the USA?
Please confirm whether you are a US resident or not by clicking the relevant button below. If you choose the wrong option, being a US resident, you will not be able to open an account with InstaTrade anyway.
We are sorry for any inconvenience caused by this message.


