See also

 04.04.2025 09:04 AM
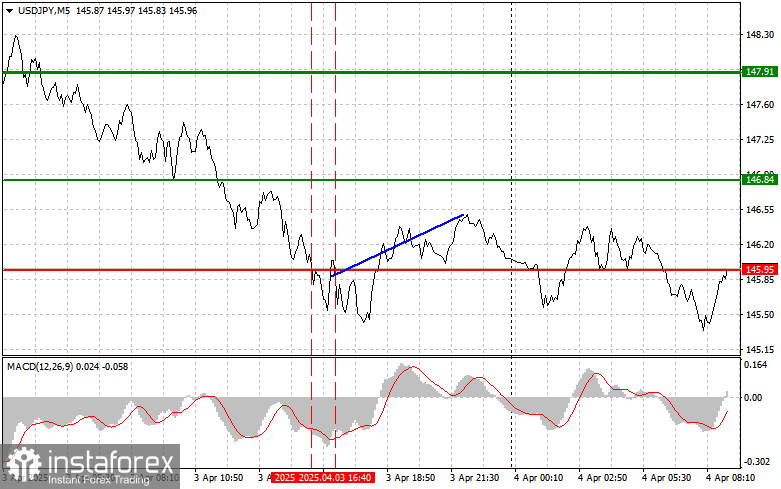
The price test at 145.95 occurred when the MACD indicator moved significantly below the zero line, limiting the pair's downside potential. The second test of 145.95 coincided with the MACD recovering from the oversold zone, allowing Scenario #2 for buying the dollar to play out. However, before the pair's rise, there was a rather sharp decline, which I failed to sit through, resulting in a loss being realized.
The yen continues to be in demand as a safe-haven asset following Trump's recent implementation of trade tariffs. The U.S. administration's policies have seriously undermined the short-term outlook for the American economy, prompting traders to sell the dollar and buy the yen. Investors seeking to protect their assets traditionally turn to the yen during periods of instability. The Japanese currency also benefits from internal factors. The Bank of Japan plans to continue raising interest rates, and while these expectations are cautious, they support the yen and make it more attractive for long-term investors.
Given the currently bearish market, it is preferable to keep trading in the direction of a USD/JPY decline, and any solid corrections in the pair—if they occur—can help identify entry points.
For intraday strategy, I will focus primarily on implementing Scenarios #1 and #2.
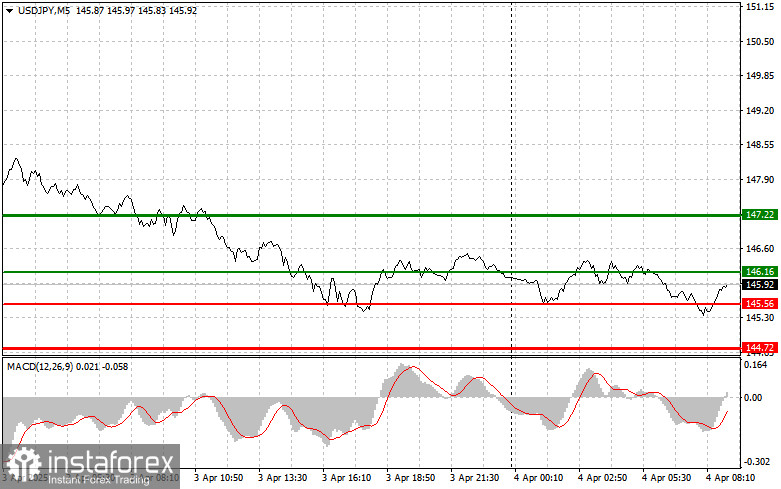
Scenario #1: I plan to buy USD/JPY today at the entry point around 146.16 (green line on the chart), targeting 147.22 (thicker green line on the chart). Around 147.22, I intend to exit long positions and open shorts in the opposite direction (anticipating a 30–35 pip move in the opposite direction). It's best to re-enter long positions on corrections and significant pullbacks in USD/JPY. Important! Before buying, ensure the MACD indicator is above the zero line and beginning to rise.
Scenario #2: I also plan to buy USD/JPY today if there are two consecutive tests of the 145.56 level when the MACD indicator is in the oversold zone. This will limit the pair's downside potential and trigger an upward reversal. A rise toward the opposite levels of 146.16 and 147.22 can be expected.
Scenario #1: I plan to sell USD/JPY today only after a breakout below 145.56 (red line on the chart), which would lead to a rapid decline in the pair. The key target for sellers will be the 144.72 level, where I intend to exit the short position and immediately open long positions in the opposite direction (anticipating a 20–25 pip move back). Selling pressure could return at any moment. Important! Before selling, ensure the MACD indicator is below the zero line and beginning to decline.
Scenario #2: I also plan to sell USD/JPY today if there are two consecutive tests of the 146.16 level when the MACD indicator is in the overbought zone. This will limit the pair's upside potential and trigger a downward reversal. A decline toward the opposite levels of 145.56 and 144.72 can be expected.