See also

 08.10.2024 09:57 AM
EUR/USD
Higher Time Frames
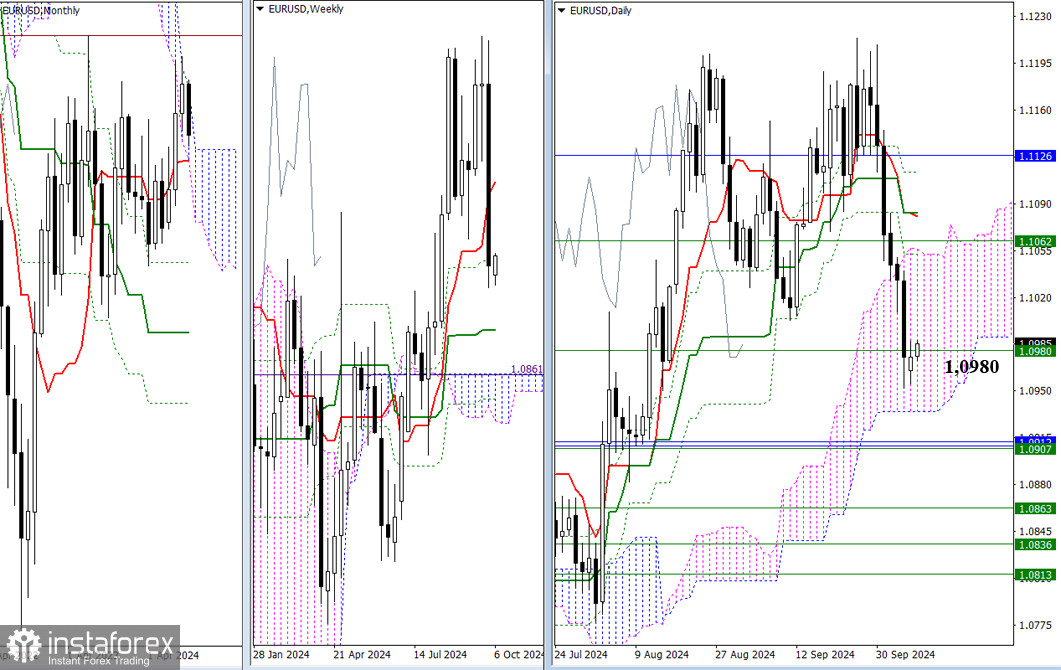
On the first day of the new week, the market barely moved. The bearish players have taken a break. Their targets remain at 1.0935 (the lower boundary of the daily cloud) and around 1.0907-12 (the weekly medium-term trend + monthly short-term trend + lower boundary of the monthly cloud). Currently, the weekly Fibonacci Kijun (1.0980) is exerting an influence, so the situation can only change once the market moves away from this level's impact. The next upward target for the bulls is the area with clustered resistance from different time intervals around 1.1052 – 1.1062 – 1.1080.
H4 – H1
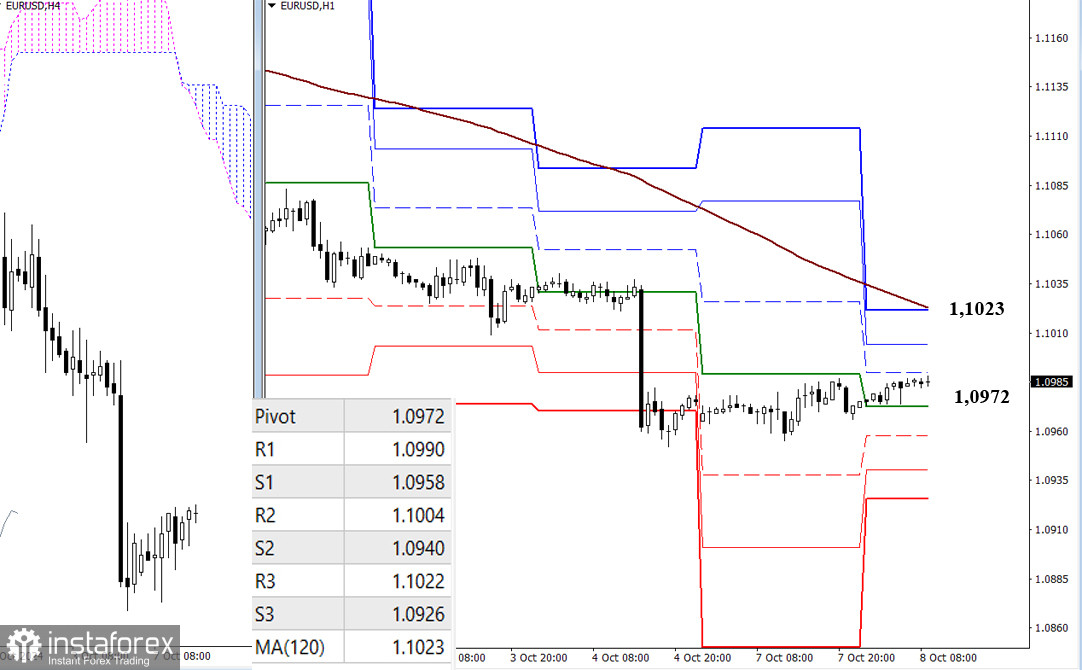
The bears still hold the main advantage on the lower time frames, though a slow upward correction is developing. The bulls have already consolidated above the central Pivot level of the day (1.0972) and are now targeting key resistance at the weekly long-term trend (1.1023). Gaining control over the weekly trend provides the main advantage in the current balance of power. The classic Pivot levels R1 (1.0990) and R2 (1.1004) may provide intermediate-term resistance to the trend. In case of bearish activity, the intraday downward targets will be the support of the classic Pivot levels, located today at 1.0958 – 1.0940 – 1.0926.
***
Higher Time Frames
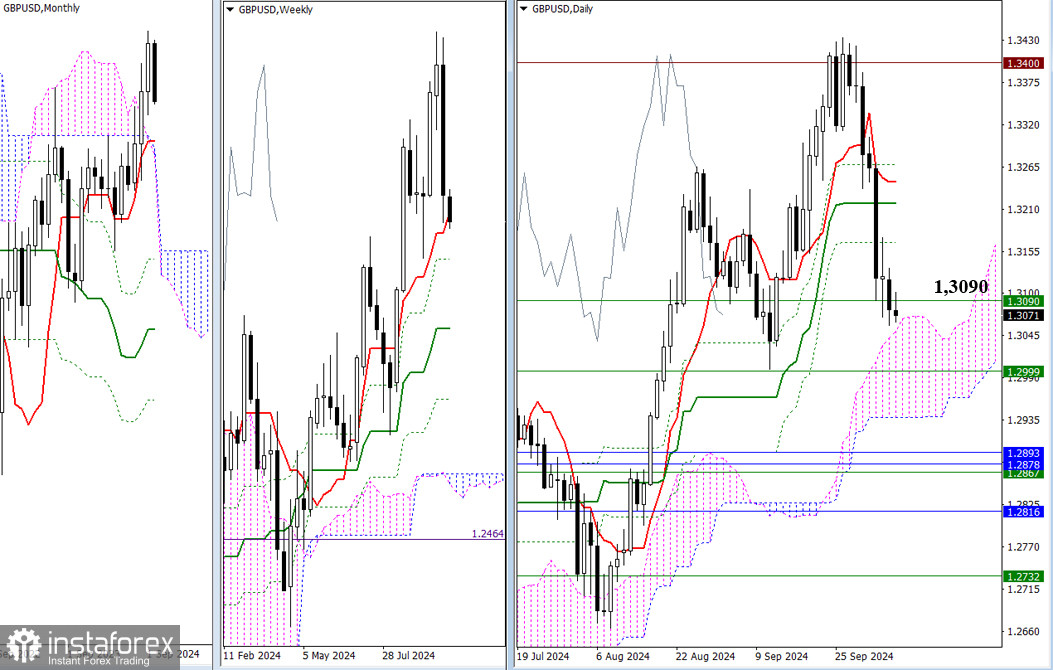
The tested support of the weekly short-term trend (1.3090) currently influences the situation. The result of this interaction has not yet been determined due to the nature of this being a weekly level. However, the bears have managed to update last week's low. If they continue the decline, attention will shift to the daily cloud (1.3051 – 1.2938) and weekly support (1.2999). If bullish players take control of the strong weekly support (1.3090), we could see a retest of the daily Ichimoku cross levels passed earlier (1.3166 – 1.3217 – 1.3245 – 1.3268).
H4 – H1
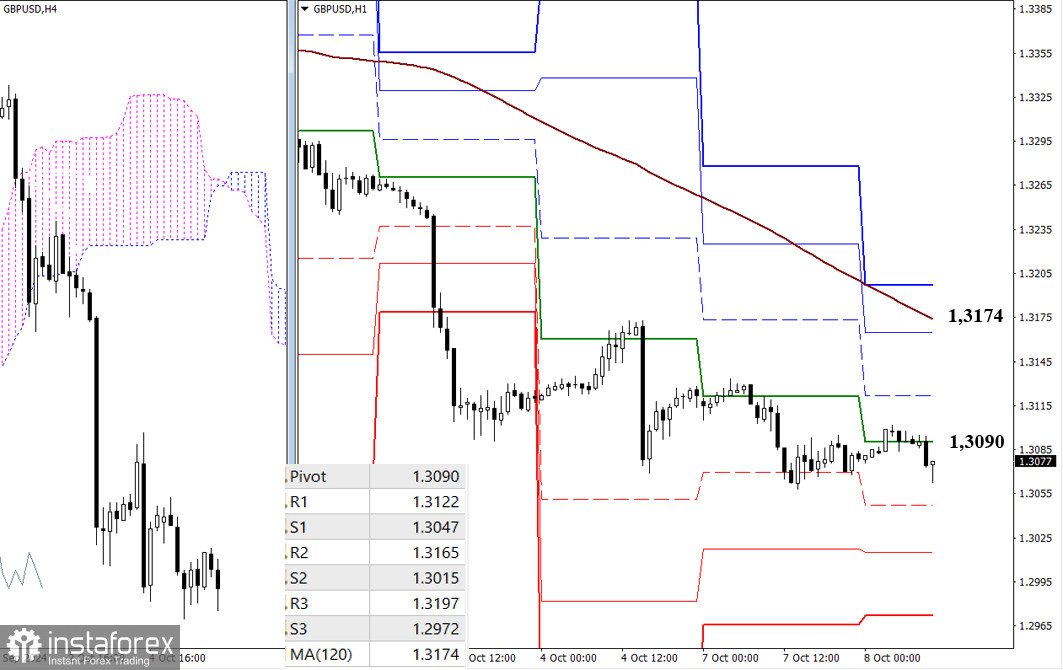
On the lower time frames, the pair is currently in a corrective phase and is testing the central Pivot level of the day (1.3090) for strength. If the correction develops further, the bulls will need to overcome the intermediate resistances at R1 (1.3122) – R2 (1.3165) and take control of the weekly long-term trend (1.3174). If the bears manage to end the correction, update the low of the downtrend (1.3058), and continue the decline, then intraday supports at the classic Pivot levels (1.3047 – 1.3015 – 1.2972) may come into play.
***
Technical analysis tools used:
You have already liked this post today
*The market analysis posted here is meant to increase your awareness, but not to give instructions to make a trade.


