See also

 07.10.2024 02:48 PM
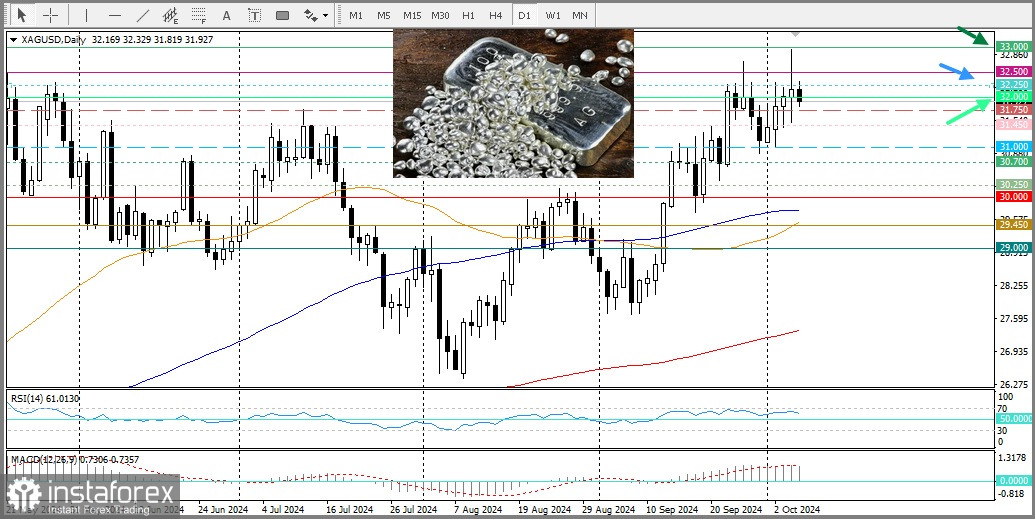
Silver starts the new week on a weaker note, continuing to pull back from the highest level reached since December 2012 on Friday. Recent repeated failures to break through the $32.00 level on the daily chart represent the formation of a bearish multiple top pattern. Meanwhile, the oscillators on the daily chart remain comfortably in positive territory, supporting the potential for buying on declines in the $31.75 level. This should limit the decline of the white metal to the horizontal support at $31.45.
A drop could pull the commodity down to $31.00. Some subsequent sales below last week's low in the $30.90 level would make the XAG/USD pair vulnerable to further acceleration toward the intermediate support at $30.70, then $30.25, on the way to the psychological level of $30.00, followed by the 100-day and 50-day simple moving averages (SMA).
However, to position for an extension of the two-month uptrend, bulls need to wait for firm strength above the $32.00 level and sustained momentum beyond the supply zone at $32.25. Then, the XAG/USD pair may attempt to conquer the round level of $33.00 before rising further to the December 2012 swing high at $33.85.
This mixed technical setup suggests caution before placing aggressive bearish positions.
You have already liked this post today
*The market analysis posted here is meant to increase your awareness, but not to give instructions to make a trade.


