See also


 26.09.2022 10:50 AM
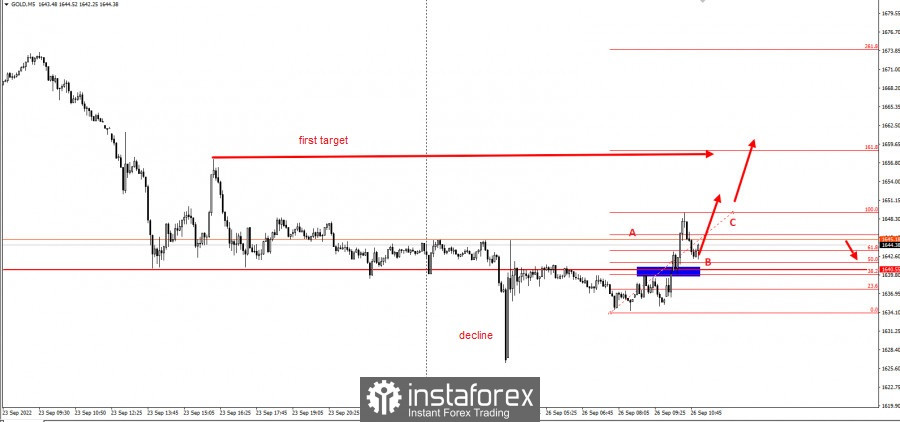
Two events happened after a rather long sell-off in gold. First is the start of purchases, which may lead to a strong correction in prices.
And since previous movements form a three-wave pattern (ABC), where wave A represents bullish pressure, traders can enter the market by buying up to the 50% retracement level, with stop loss at 1631. Exit the market on the breakdown of 1657 and 1688.
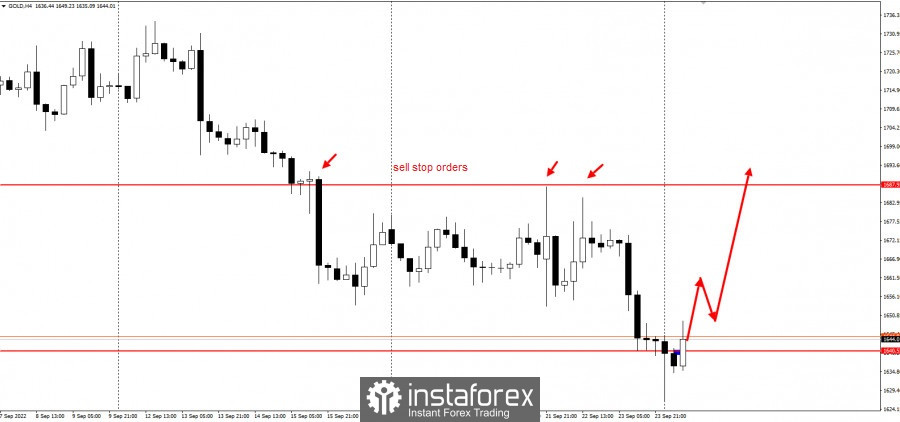
The second event is the sell stop orders left by market makers, which can be used as basis when entering the market using "Stop Hunting" strategy.
In this case, the potential price movement is more than 4,000 pips.
The trading ideas are based on the "Price Action" and "Stop Hunting" methods.
Good luck and have a nice day! Don't forget to control the risks.
You have already liked this post today
*The market analysis posted here is meant to increase your awareness, but not to give instructions to make a trade.
In my morning forecast, I highlighted the 1.3247 level as a reference point for market entry decisions. Let's take a look at the 5-minute chart and analyze what happened
In my morning forecast, I highlighted the 1.1341 level as a key point for market entry decisions. Let's take a look at the 5-minute chart and analyze what happened there
Analysis of Tuesday's Trades 1H Chart of GBP/USD Throughout Tuesday, the GBP/USD pair continued its upward movement. As we can see, the British currency doesn't need any particular reason
Analysis of Tuesday's Trades 1H Chart of EUR/USD On Tuesday, the EUR/USD currency pair pulled back slightly, which can be considered a purely technical correction. Yesterday — and generally —
On Tuesday, the GBP/USD currency pair continued its upward movement for most of the day. There were no significant reasons or fundamental grounds for this, but the entire currency market
The EUR/USD currency pair began a long-awaited decline on Tuesday, although it didn't fall very far or for very long. It's worth noting that there were no fundamental reasons
In my morning forecast, I highlighted the 1.1377 level and planned to make trading decisions from there. Let's look at the 5-minute chart and break down what happened. A rise
Analysis of Monday's Trades 1H Chart of GBP/USD On Monday, the GBP/USD pair continued its upward movement without any trouble. There were no macroeconomic reasons for this, and even
InstaTrade in figures

Your IP address shows that you are currently located in the USA. If you are a resident of the United States, you are prohibited from using the services of InstaFintech Group including online trading, online transfers, deposit/withdrawal of funds, etc.
If you think you are seeing this message by mistake and your location is not the US, kindly proceed to the website. Otherwise, you must leave the website in order to comply with government restrictions.
Why does your IP address show your location as the USA?
Please confirm whether you are a US resident or not by clicking the relevant button below. If you choose the wrong option, being a US resident, you will not be able to open an account with InstaTrade anyway.
We are sorry for any inconvenience caused by this message.


