See also


 08.03.2023 02:32 PM
The EUR/USD pair crashed yesterday ahead and after Fed Chair Powell's Testimony. It has dropped by 1.59% from yesterday's high of 1.0694 to 1.0524 today's low. After such a big drop, the rate could try to rebound in the short term. Still, the downside pressure remains high, so the currency pair could extend its sell-off anytime.
Today, the fundamentals should play an important role again. Earlier, German Retail Sales dropped by 0.3% even if the specialists expected a 2.3% growth, while German Industrial Production came in better than expected. Furthermore, the Eurozone Employment Change rose by 0.3% less compared to the 0.4% growth expected, while the Revised GDP came in line with expectations.
Fundamentally, the ADP Non-Farm Employment Change is forecasted to increase from 106K in January to 197K in February. Moreover, the JOLTS Job Openings indicator may drop to 10.58M from 11.01M, while Fed Chair Powell Testifies could really shake the markets again. Don't forget that the BOC Rate Statement could bring some action as well.
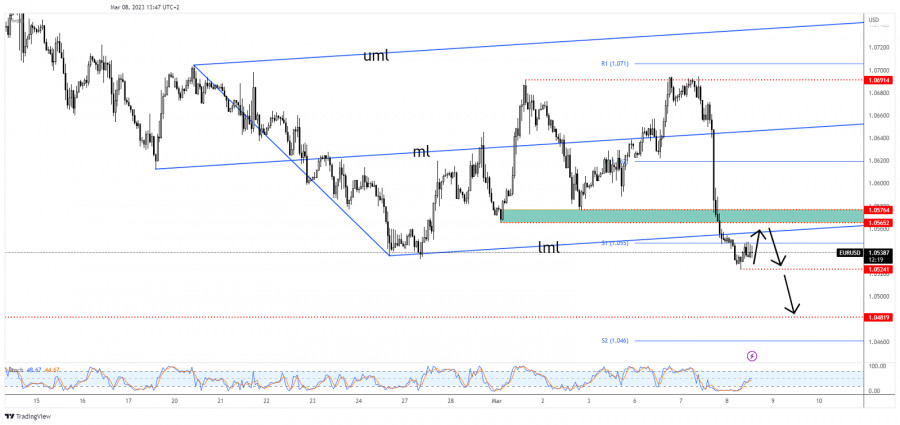
As you can see on the H1 chart, the rate found resistance at 1.0691 and then it turned to the downside, ignoring the median line (ml), the pivot point of 1.0620, and the 1.0576 - 1.0565 support zone.
Now, it has taken out the lower median line (lml) and the S1 (1.0550) as well. In the short term, it could try to come back to test and retest the broken levels before extending its sell-off.
As long as it stays below the lower median line (lml) and under 1.0565 - 1.0576, EUR/USD could drop deeper. Testing and retesting these levels may announce a new sell-off. A new lower low, dropping and closing below 1.0524 validates a further drop towards 1.0481 and represents a new selling opportunity.
You have already liked this post today
*The market analysis posted here is meant to increase your awareness, but not to give instructions to make a trade.
The eagle indicator has reached overbought levels. However, the metal could still reach the high around 8/8 Murray, which represents a strong barrier for gold. Below this area, we could
From what is seen on the 4-hour chart, the EUR/GBP cross currency pair appears to be moving above the EMA (100), which indicates that Buyers dominate the currency pair
With the appearance of Convergence between the price movement of the main currency pair USD/JPY with the Stochastic Oscillator indicator and the position of the EMA (100) which is above
Useful links: My other articles are available in this section InstaForex course for beginners Popular Analytics Open trading account Important: The begginers in forex trading need to be very careful
Useful links: My other articles are available in this section InstaForex course for beginners Popular Analytics Open trading account Important: The begginers in forex trading need to be very careful
From what we see on the 4-hour chart of the Nasdaq 100 index, there are several interesting things, namely, first, the price movement is moving below the MA (100), second
Graphical patterns
indicator.
Notices things
you never will!
InstaTrade
PAMM accounts

Your IP address shows that you are currently located in the USA. If you are a resident of the United States, you are prohibited from using the services of InstaFintech Group including online trading, online transfers, deposit/withdrawal of funds, etc.
If you think you are seeing this message by mistake and your location is not the US, kindly proceed to the website. Otherwise, you must leave the website in order to comply with government restrictions.
Why does your IP address show your location as the USA?
Please confirm whether you are a US resident or not by clicking the relevant button below. If you choose the wrong option, being a US resident, you will not be able to open an account with InstaTrade anyway.
We are sorry for any inconvenience caused by this message.

