See also


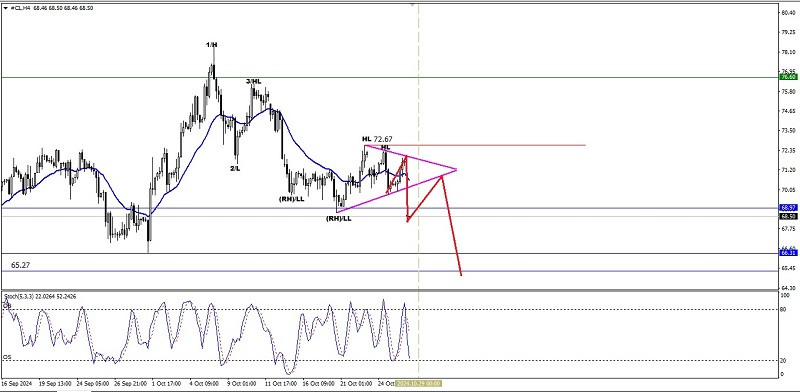
From what is seen on the 4-hour chart, the crude oil commodity asset seems moving in a Sideways and ranging condition where this is confirmed by the appearance of a Triangle pattern indicating a decrease in volatility in the market and EMA 21 moving in the middle of the Candle body with a flat and even slope position even though the Stochastic Oscillator indicator is still in the Crossing Sell position so that based on these facts in the near future #CL has the potential to weaken as long as there is no strengthening that breaks through and closes above the level of 72.67 then #CL will try to test and break as well as close below the level of 68.97 if this level is successfully broken and closes below it then #CL has the potential to continue its weakening back to the level of 66.31 as its main target and 65.27 as the next target if supported by good volatility and momentum.
(Disclaimer)
You have already liked this post today
*The market analysis posted here is meant to increase your awareness, but not to give instructions to make a trade.


