#HSI (Hang Seng Index). Exchange rate and online charts.
Currency converter
22 Jan 2025 06:59
(0%)
Closing price, the previous day.
Opening price.
The highest price over the last trading day.
The lowest price over the last trading day
Price range high in the last week
Price range low in the last week
The Hang Seng Index (abbreviated HSI) is a benchmark stock market index of the Hong Kong Stock Exchange. It comprises 34 largest companies in Hong Kong which account for almost 65% of capitalization of the Hong Kong financial hub. HSI was introduced in 1969 by HSI Services Limited which is still dealing with analysis of information and compilation of ratings. The index records and monitors daily changes of stock prices of these companies. So, HSI is the main barometer of the overall market performance in Hong Kong. HSI embraces four sectors of the economy such as commerce and industry, finance, utilities, and land properties.
Besides, Hang Seng Index is a convenient instrument to invest in Hong Kong’s stock market which is one of major financial hubs not only in Asia, but on the global scale. Importantly, the economies of Hong Kong and China are closely connected as Hong Kong has the status of the special administrative region of the People’s Republic of China. So this indicator of Hong Kong’s stock market enables investors to put up capital for China’s economy which is considered to be one of the booming economies in the world. Last but not least, high liquidity of HSI makes it possible to use it for speculative trading.
Trading Hang Seng Index is available through different financial instruments including Exchange-Traded Funds (ETF), contracts for differences (CFDs), and futures contracts. Futures are the most convenient and liquid means of implementing medium- and long-term strategies as well as speculative trading.
See Also
- Technical analysis / Video analytics
Forex forecast 21/01/2025: EUR/USD, GBP/USD, USD/CAD, SP500, and Bitcoin
Technical analysis of EUR/USD, GBP/USD, USD/CAD, SP500, and Bitcoin.Author: Sebastian Seliga
12:59 2025-01-21 UTC+2
1768
The current position of the Japanese yen reflects a complex balance between the positive sentiment in equity markets and expectations of interest rate hikes by the Bank of Japan.Author: Irina Yanina
12:37 2025-01-21 UTC+2
1093
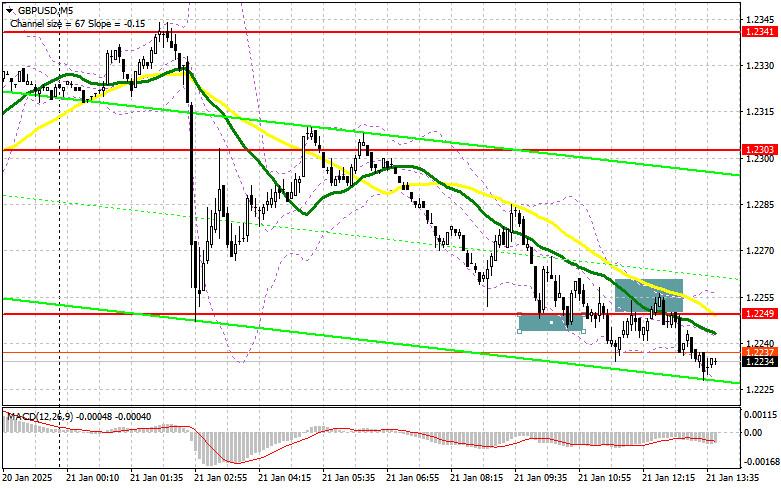
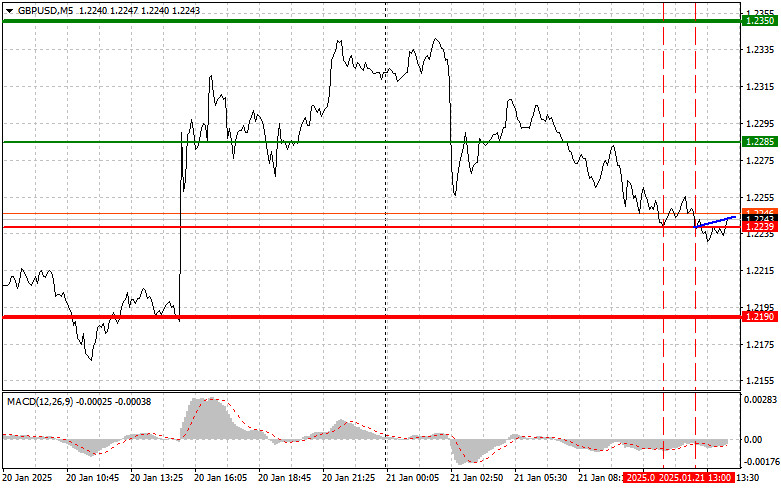
In my morning forecast, I focused on the level of 1.2249 and planned to make trading decisions from thereAuthor: Miroslaw Bawulski
15:34 2025-01-21 UTC+2
1033
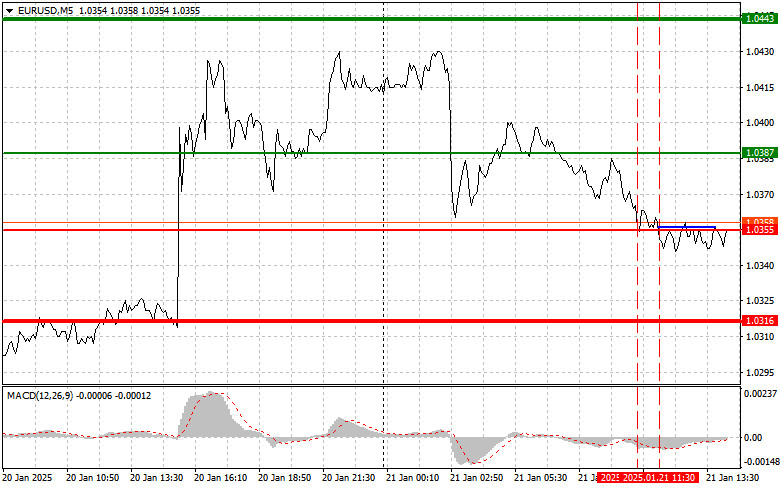
- The test of the 1.0355 price level occurred when the MACD indicator had already dropped significantly below the zero line
Author: Jakub Novak
15:39 2025-01-21 UTC+2
1003
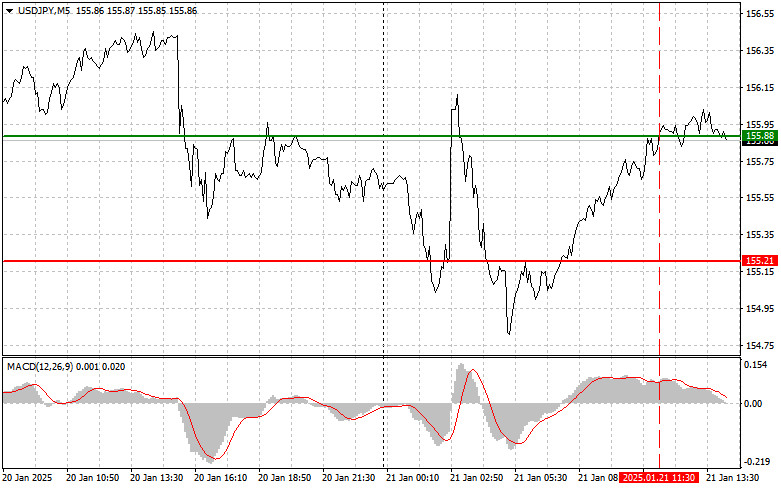
The test of the 155.88 price level occurred when the MACD indicator had already moved significantly above the zero lineAuthor: Jakub Novak
15:47 2025-01-21 UTC+2
1003
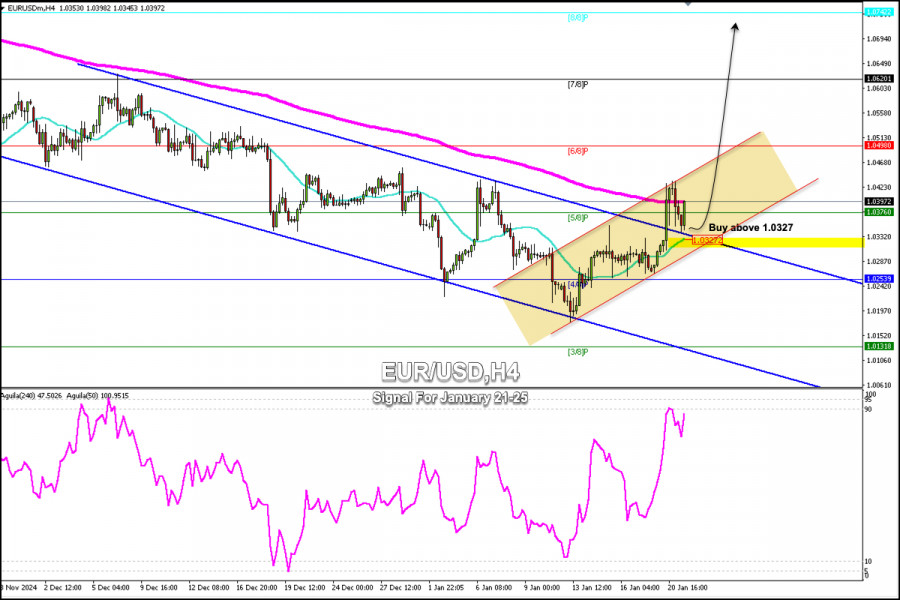
Technical analysisTrading Signals for EUR/USD for January 21-25, 2025: buy above 1.0327 (21 SMA - 200 EMA)
In case the Euro falls below the 21 SMA located at 1.0327, the bearish outlook could resume and we could expect a new bearish cycle. So, the Euro could reach 3/8 of Murray located at 1.0131.Author: Dimitrios Zappas
17:59 2025-01-21 UTC+2
988
- Technical analysis
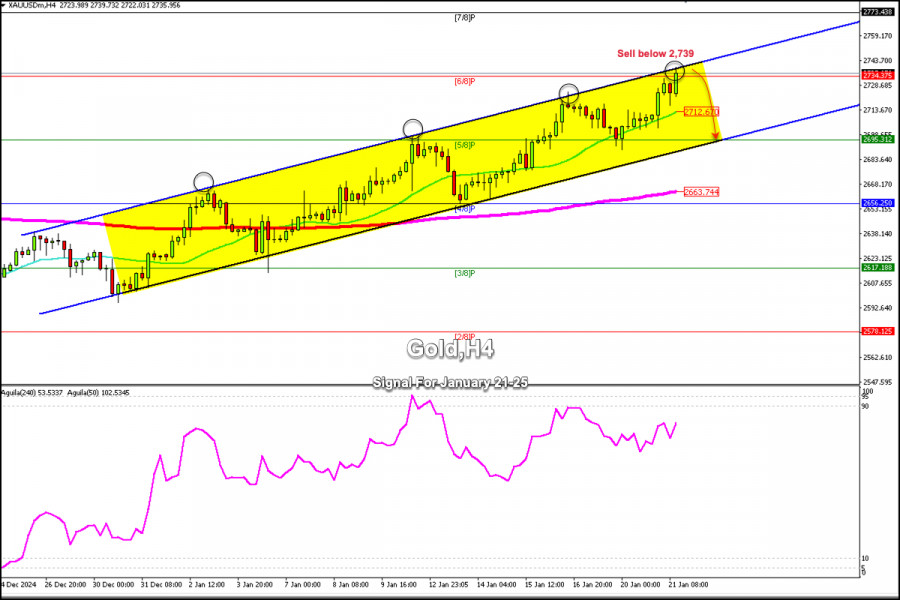
Trading Signals for GOLD for January 21-25, 2025: sell below $2,739 (21 SMA - 6/8 Murray)
On the contrary, if gold consolidates below 6/8 of Murray, we could expect the metal to fall towards the 21 SMA located at 2,712 and finally towards 5/8 of Murray located at 2,695.Author: Dimitrios Zappas
17:57 2025-01-21 UTC+2
958
The test of the 1.2239 price level occurred when the MACD indicator had already dropped significantly below the zero lineAuthor: Jakub Novak
15:43 2025-01-21 UTC+2
943
Crypto-currenciesTrading Recommendations for the Cryptocurrency Market on January 21st (U.S. Session)
Bitcoin and Ethereum returned to a gradual upward trend during the first half of the dayAuthor: Miroslaw Bawulski
16:00 2025-01-21 UTC+2
943
- Technical analysis / Video analytics
Forex forecast 21/01/2025: EUR/USD, GBP/USD, USD/CAD, SP500, and Bitcoin
Technical analysis of EUR/USD, GBP/USD, USD/CAD, SP500, and Bitcoin.Author: Sebastian Seliga
12:59 2025-01-21 UTC+2
1768
- The current position of the Japanese yen reflects a complex balance between the positive sentiment in equity markets and expectations of interest rate hikes by the Bank of Japan.
Author: Irina Yanina
12:37 2025-01-21 UTC+2
1093
- In my morning forecast, I focused on the level of 1.2249 and planned to make trading decisions from there
Author: Miroslaw Bawulski
15:34 2025-01-21 UTC+2
1033
- The test of the 1.0355 price level occurred when the MACD indicator had already dropped significantly below the zero line
Author: Jakub Novak
15:39 2025-01-21 UTC+2
1003
- The test of the 155.88 price level occurred when the MACD indicator had already moved significantly above the zero line
Author: Jakub Novak
15:47 2025-01-21 UTC+2
1003
- Technical analysis
Trading Signals for EUR/USD for January 21-25, 2025: buy above 1.0327 (21 SMA - 200 EMA)
In case the Euro falls below the 21 SMA located at 1.0327, the bearish outlook could resume and we could expect a new bearish cycle. So, the Euro could reach 3/8 of Murray located at 1.0131.Author: Dimitrios Zappas
17:59 2025-01-21 UTC+2
988
- Technical analysis
Trading Signals for GOLD for January 21-25, 2025: sell below $2,739 (21 SMA - 6/8 Murray)
On the contrary, if gold consolidates below 6/8 of Murray, we could expect the metal to fall towards the 21 SMA located at 2,712 and finally towards 5/8 of Murray located at 2,695.Author: Dimitrios Zappas
17:57 2025-01-21 UTC+2
958
- The test of the 1.2239 price level occurred when the MACD indicator had already dropped significantly below the zero line
Author: Jakub Novak
15:43 2025-01-21 UTC+2
943
- Crypto-currencies
Trading Recommendations for the Cryptocurrency Market on January 21st (U.S. Session)
Bitcoin and Ethereum returned to a gradual upward trend during the first half of the dayAuthor: Miroslaw Bawulski
16:00 2025-01-21 UTC+2
943


