
 29.01.2024 10:42 AM
The economic calendar lacked high-impact data on Friday.
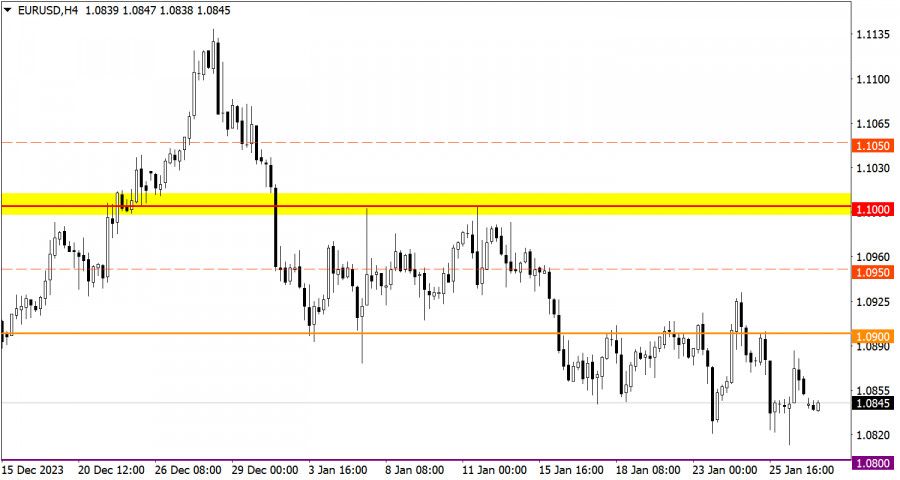
EUR/USD reached the bottom of the correction cycle accompanied by pronounced speculative activity.
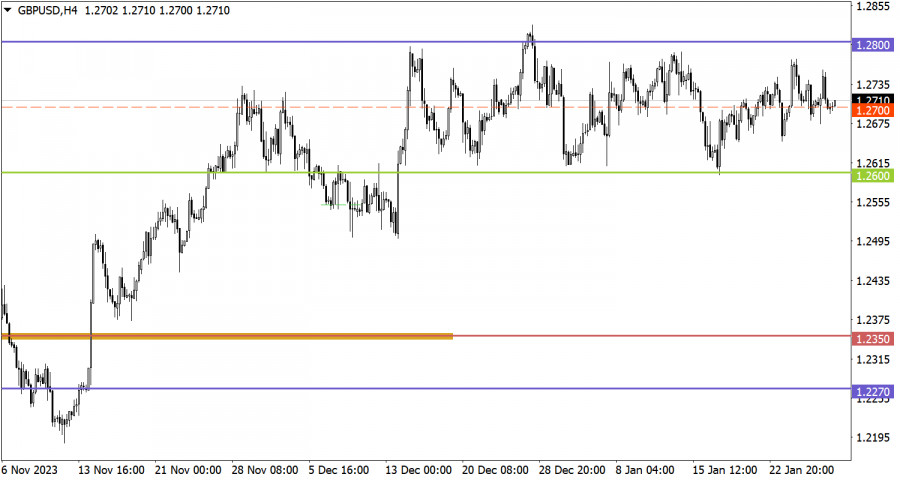
The GBP/USD pair had been trapped within the sideways channel between 1.2600 and 1.2800 for the seventh week in a row. There is periodic speculative activity, but special attention is paid to the middle level of the sideways channel at 1.2700.
Traditionally, the new trading week begins with the empty economic calendar. This is common for Monday. Nevertheless, this week is going to be jam-packed with major events. Two central banks are holding policy meetings. As for macroeconomic data, the market will get to know inflation data for the EU and the US nonfarm payrolls for January.
The extension of the downward correction indicates the overall bearish interest among market participants. However, as before, the level of 1.0800 serves as an obstacle for the sellers, which, according to technical analysis, can put pressure on short positions. Thus, the downward cycle is limited to this level, which means some uncertainty in market sentiment. If the price settles below 1.0800 during the day, traders may add short positions.
The median level acts as an indicator of trading interest within the sideways channel. Price stabilization below this level may be followed by a movement towards the lower border of 1.2600. However, all price fluctuations so far fit within the current corridor, which, is still in the making according to technical analysis. A priority strategy among market participants is trading during a breakout of one of the borders of the sideways channel.
The candlestick chart type consists of graphic rectangles in white and black with lines at the top and bottom. With a detailed analysis of each individual candle, you can see its characteristics relative to a particular time period: opening price, closing price, maximum and minimum price.
Horizontal levels are price coordinates relative to which a price may stop or revered its trajectory. In the market, these levels are called support and resistance.
Circles and rectangles are highlighted examples where the price developed. This color highlighting indicates horizontal lines that may put pressure on the price in the future.
Up/down arrows are guidelines for a possible direction in the future.
在我早晨的預測中,我關注了1.1336這一水準,並計劃根據該水準作出市場進入決策。現在讓我們看看5分鐘的圖表並分析發生了什麼情況。
在過去24小時內,英鎊兌美元貨幣對上漲了170個點。在週五凌晨,英鎊持續走高。
週四,EUR/USD貨幣對恢復了向上的走勢,並錄得超過300點的漲幅。隨著週五的開始,該貨幣對繼續不間斷地上升。
在過去的24小時裡,英鎊兌美元的匯率先上升,然後又下跌,接著再次上升。與之前一樣,在小時圖上很難識別出明顯的趨勢。
歐元/美元貨幣對在週三表現出了強勁的增長和下跌。最近,這兩種走勢都是由唐納·川普引發的。
Your IP address shows that you are currently located in the USA. If you are a resident of the United States, you are prohibited from using the services of InstaFintech Group including online trading, online transfers, deposit/withdrawal of funds, etc.
If you think you are seeing this message by mistake and your location is not the US, kindly proceed to the website. Otherwise, you must leave the website in order to comply with government restrictions.
Why does your IP address show your location as the USA?
Please confirm whether you are a US resident or not by clicking the relevant button below. If you choose the wrong option, being a US resident, you will not be able to open an account with InstaTrade anyway.
We are sorry for any inconvenience caused by this message.


