আরও দেখুন


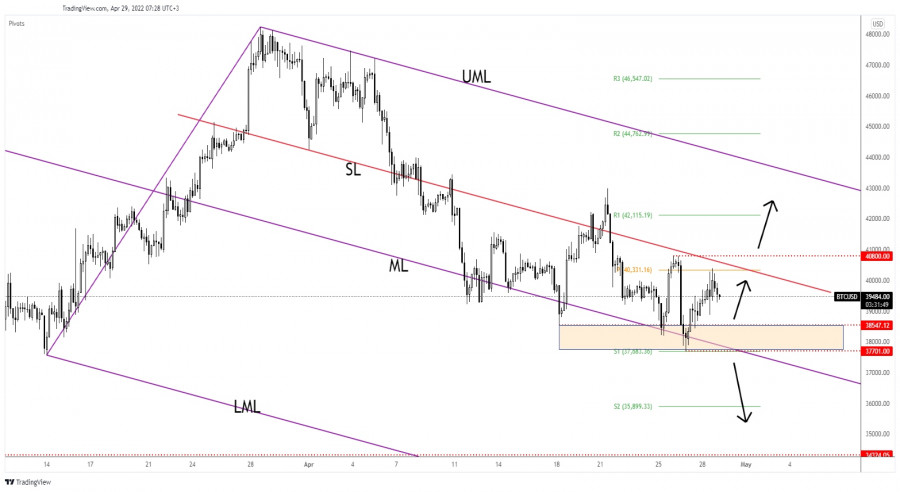
BTC/USD rebounded in the short term and now is trading at the 39,491 level at the time of writing. It has dropped by 2.51% from yesterday's high of 40,387. Technically, the price action signaled an oversold situation. The RSI shows a bullish divergence but it's premature to talk about a new leg higher.
BTC/USD is up by 0.37% in the last 24 hours and it's down by 2.78% in the last 7 days. In the short term, it could move somehow sideways, that's why we need to wait for a fresh opportunity.
BTC/USD found support on the median line (ML) again. This stands as a strong dynamic obstacle. 37,701 - 38,547 stands as a static support zone. The near-term resistance is represented by the inside sliding line (SL) and by the weekly pivot point of 40,331.
40,800 is seen as resistance as well. The bias remains bearish as long as it stays under the sliding line (SL). Personally, I would like the rate to come back to test and retest the 38,547 - 37,701 area before trying to develop a new swing higher.
False breakdowns with great separation below the support levels may signal a bullish momentum. Still, a potential bullish movement could be activated only by a valid breakout above 40,800.
The upside scenario could be invalidated if the rate makes a new lower low, if it makes a valid breakdown below the median line (ML).
You have already liked this post today
*এখানে পোস্ট করা মার্কেট বিশ্লেষণ আপনার সচেতনতা বৃদ্ধির জন্য প্রদান করা হয়, ট্রেড করার নির্দেশনা প্রদানের জন্য প্রদান করা হয় না।


