
 18.10.2022 03:38 PM
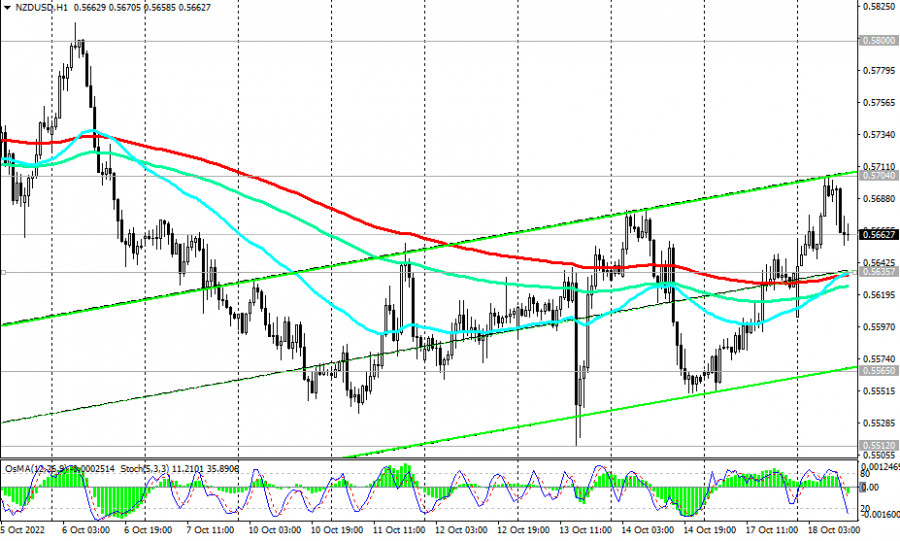
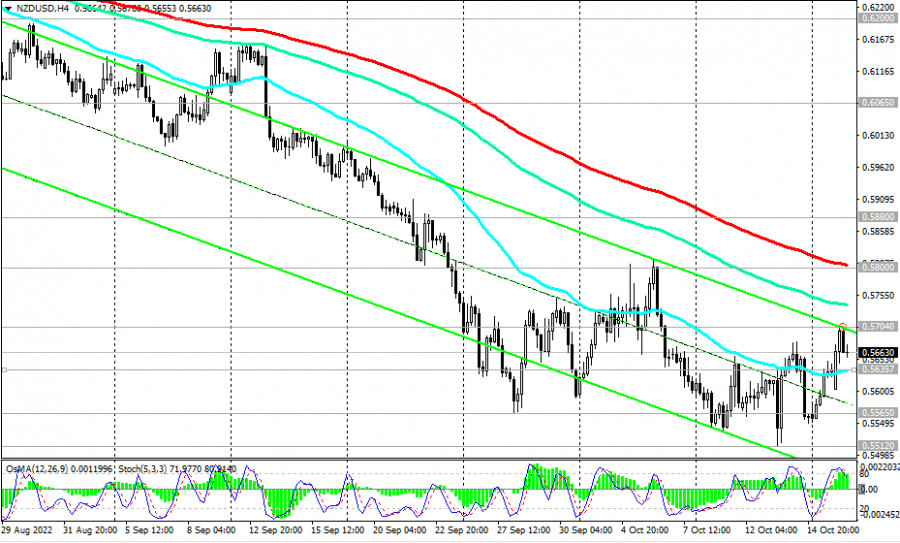
Today, NZD/USD half retains the bullish momentum gained from the inflation data in New Zealand that exceeded the forecast, while also trying to stay in the zone above the short-term important support level of 0.5635 (200 EMA on the 1-hour chart). As of writing, the pair is trading near the 0.5662 mark. It is characteristic that the OsMA and Stochastic technical indicators paint a contradictory picture: on the daily and weekly charts they turn to long positions, and on the 1-hour and 4-hour charts they turn to short positions, signaling the end of the upward correction.
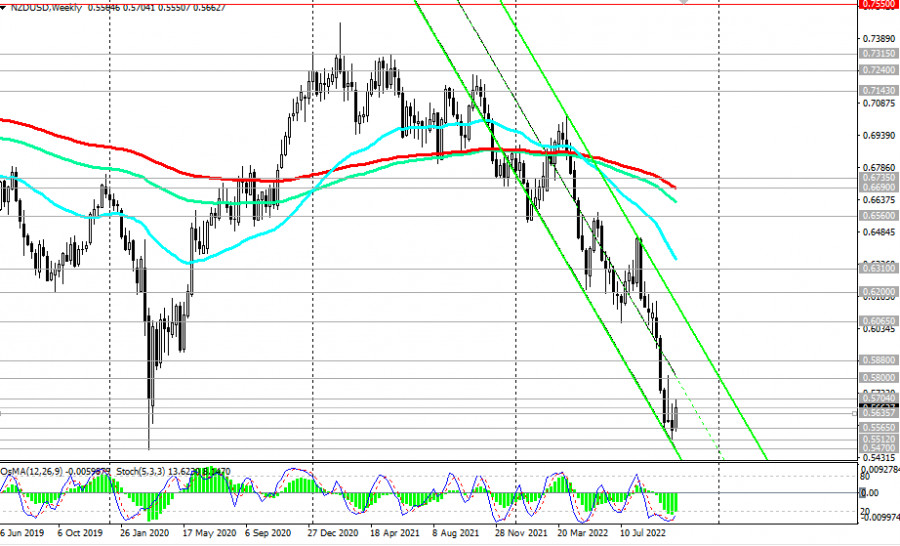
The signal for the resumption of sales will be a breakdown of the support level of 0.5635. In this case, NZD/USD will head deeper into the descending channel on the weekly chart and towards 0.5470.
In an alternative scenario, the upward correction will continue to the resistance levels of 0.5800 (200 EMA on the 4-hour chart), 0.5880 (50 EMA on the daily chart).
In general, the downward dynamics of NZD/USD prevails, while the pair remains in the zone of a long-term bear market—below the key resistance levels of 0.6690 (200 EMA on the weekly chart), 0.6310 (200 EMA on the daily chart). Only their breakdown will bring the pair back into the zone of a long-term bull market.
And today, the volatility in the NZD/USD pair may increase again (in the period after 13:15 - 14:00 GMT), which will be associated with the publication of macro statistics for the US and New Zealand, as well as at 21:30 during the speech of Fed representative Neel Kashkari.
Support levels: 0.5635, 0.5600, 0.5565, 0.5512, 0.5470
Resistance levels: 0.5704, 0.5800, 0.5880, 0.6065, 0.6200, 0.6310, 0.6560, 0.6690, 0.6735
Trading Tips
Sell Stop 0.5620. Stop-Loss 0.5710. Take-Profit 0.5600, 0.5565, 0.5512, 0.5470
Buy Stop 0.5710. Stop-Loss 0.56250. Take-Profit 0.5800, 0.5880, 0.6065, 0.6200, 0.6310, 0.6560, 0.6690, 0.6735
You have already liked this post today
*The market analysis posted here is meant to increase your awareness, but not to give instructions to make a trade.
خلال الـ 24 ساعة الماضية، ارتفع زوج الجنيه الإسترليني/الدولار الأمريكي بمقدار 170 نقطة. وخلال الليل حتى صباح الجمعة، واصل الجنيه الإسترليني الارتفاع. قبل بضعة أيام، أشرنا إلى أن الدولار
يوم الخميس، استأنف زوج العملات اليورو/الدولار الأمريكي حركته الصعودية وسجل مكاسب تزيد عن 300 نقطة. ومع بداية يوم الجمعة، واصل الزوج نموه المستمر. الأسباب وراء الانهيار الجديد للدولار الأمريكي يسهل
أظهر زوج العملات EUR/USD نموًا قويًا للغاية يوم الخميس، وهي حركة ربما لم تفاجئ أحدًا حتى الآن. كما أبلغنا أن الرسوم الجمركية على الصين قد ارتفعت إلى 125%، قام ترامب
قضى زوج الجنيه الإسترليني/الدولار الأمريكي الـ 24 ساعة الماضية في الارتفاع، ثم الانخفاض مرة أخرى، ثم الارتفاع مرة أخرى. كما كان الحال من قبل، من المستحيل تحديد اتجاه واضح
أظهر زوج العملات اليورو/الدولار الأمريكي نمواً قوياً وانخفاضاً يوم الأربعاء. في الآونة الأخيرة، تم تحفيز كلا التحركين بواسطة دونالد ترامب. أولاً، انتشرت أخبار تفيد بأن الولايات المتحدة كانت تفرض تعريفات
في يوم الأربعاء، أظهر زوج العملات GBP/USD تحركات متباينة طوال اليوم، لكنه بشكل عام حافظ على اتجاه هبوطي - إذا كان بإمكاننا حتى أن نطلق على السلوك الحالي "اتجاه"
شارت الفوركس
على شبكة الانترنت

Your IP address shows that you are currently located in the USA. If you are a resident of the United States, you are prohibited from using the services of InstaFintech Group including online trading, online transfers, deposit/withdrawal of funds, etc.
If you think you are seeing this message by mistake and your location is not the US, kindly proceed to the website. Otherwise, you must leave the website in order to comply with government restrictions.
Why does your IP address show your location as the USA?
Please confirm whether you are a US resident or not by clicking the relevant button below. If you choose the wrong option, being a US resident, you will not be able to open an account with InstaTrade anyway.
We are sorry for any inconvenience caused by this message.


