
 27.01.2023 07:05 PM
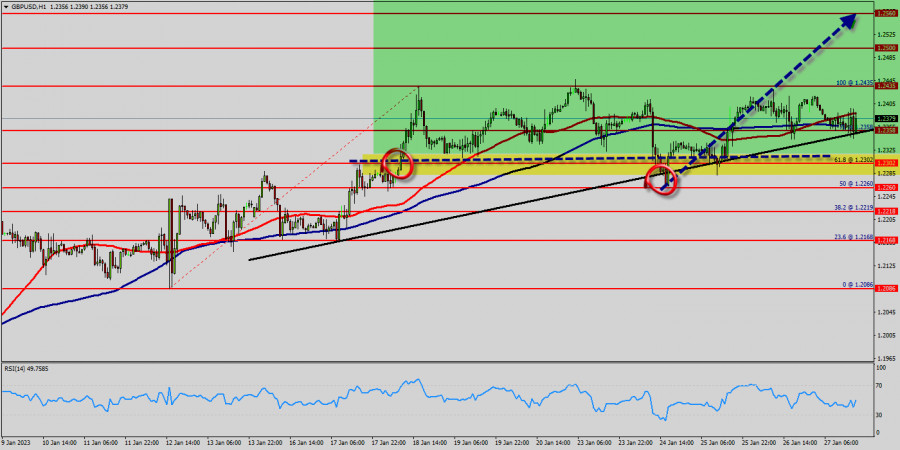
The bullish trend is currently very strong for the GBP/USD pair. As long as the price remains above the weekly support at 1.2260, you could try to take advantage of the bullish rally. The first bullish objective is located at 1.2435. The bullish momentum would be revived by a break in this resistance. Buyers would then use the next resistance located at 1.2500 USD as an objective. Crossing it would then enable buyers to target 1.2500 USD. Be careful, given the powerful bearish rally underway, excesses could lead to a short-term rebound. If this is the case, remember that trading against the trend may be riskier. It would seem more appropriate to wait for a signal indicating reversal of the trend.
Today, the GBP/USD pair has broken resistance at the level of 1.2260 which acts as support now. Thus, the pair has already formed minor support at 1.2260. The strong support is seen at the level of 1.2218 because it represents the weekly support 1. Equally important, the RSI and the moving average (100) are still calling for an uptrend. Therefore, the market indicates a bullish opportunity at the level of 1.2260 on the hourly chart. Also, if the trend is buoyant, then the currency pair strength will be defined as following: GBP is in an uptrend and USD is in a downtrend. Buy above the minor support of 1.2260 with the first target at 1.2358 (this price is coinciding with the ratio of 78% Fibonacci), and continue towards 1.2435 (the weekly resistance 1 - double top - last bullish wave).
On the other hand, if the price closes below the minor support, the best location for the stop loss order is seen below 1.2435; hence, the price will fall into the bearish market in order to go further towards the strong support at 1.2302 to test it again. Furthermore, the level of 1.2260 will form a double bottom.
Bearish outlook : The current rise will remain within a framework of correction. However, if the pair fails to pass through the level of 1.2435, the market will indicate a bearish opportunity below the strong resistance level of 1.2435 (the level of 1.2435 coincides with the double top too). Since there is nothing new in this market, it is not bullish yet. Sell deals are recommended below the level of 1.2435 with the first target at 1.2302. If the trend breaks the support level of 1.2302, the pair is likely to move downwards continuing the development of a bearish trend to the level 1.2219
However, In the very short term, the general bearish sentiment is confirmed by technical indicators. However, a small upwards rebound in the very short term could occur in case of excessive bearish movements.
You have already liked this post today
*The market analysis posted here is meant to increase your awareness, but not to give instructions to make a trade.
في بداية الجلسة الأمريكية، يتداول الذهب حول 3,220، مما يظهر علامات على الإرهاق. من المحتمل حدوث تصحيح تقني إضافي نحو 21SMA في الساعات القادمة. على الرسم البياني H4، يمكننا
روابط مفيدة: مقالاتي الأخرى متوفرة في هذا القسم دورة InstaForex للمبتدئين التحليلات الشائعة افتح حساب تداول مهم: يجب على المبتدئين في تداول الفوركس أن يكونوا حذرين للغاية عند اتخاذ القرارات
روابط مفيدة: مقالاتي الأخرى متوفرة في هذا القسم دورة InstaForex للمبتدئين التحليلات الشائعة افتح حساب تداول مهم: يجب على المبتدئين في تداول الفوركس أن يكونوا حذرين للغاية عند اتخاذ القرارات
على الرسم البياني لمدة 4 ساعات، يبدو أن زوج العملات المتقاطع GBP/AUD يتحرك تحت المتوسط المتحرك الأسي (21) ومؤشر المذبذب العشوائي في حالة بيع متقاطعة، لذلك في المستقبل القريب وبناءً
نادي إنستافوركس

Your IP address shows that you are currently located in the USA. If you are a resident of the United States, you are prohibited from using the services of InstaFintech Group including online trading, online transfers, deposit/withdrawal of funds, etc.
If you think you are seeing this message by mistake and your location is not the US, kindly proceed to the website. Otherwise, you must leave the website in order to comply with government restrictions.
Why does your IP address show your location as the USA?
Please confirm whether you are a US resident or not by clicking the relevant button below. If you choose the wrong option, being a US resident, you will not be able to open an account with InstaTrade anyway.
We are sorry for any inconvenience caused by this message.

